Analytics helping ‘smart’ Sydney Airport get off the ground

Sydney Airport – the main international gateway to Australia and the country’s busiest airport – is already claiming progress on its efforts to become a ‘smart airport’ after using IBM statistical and business tools to create new analytical models that combine data from a bevy of siloed information systems.
The push to improve information about the operations of the airport – used by over 37 million passengers per year, or 100,000 per day, on nearly 300,000 plane movements per year – came after business executives began expressing frustration at how long it took to get monthly reports on the airport’s passenger and other activities.
That information is crucial to planning the airport’s service capacity, resource distribution and more – but because of the nature of its operations the data had traditionally been stored across a range of systems, many owned by the 39 airlines using the airport and other commercial entities.
Because of the large and varied nature of the data that had to be compiled, reports typically took two business weeks to complete using conventional methods built around Microsoft Excel spreadsheets.
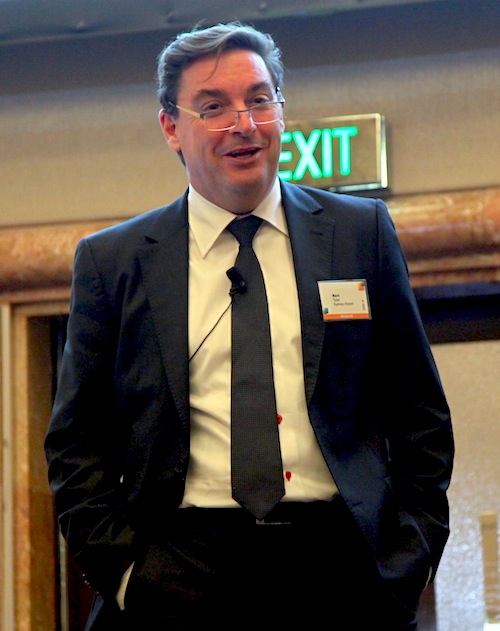
“As in other industries, the airport had a problem at the end of the month,” Mark Tyler, the airport’s manager of customer intelligence and analytics told attendees at IBM’s recent Smarter Analytics Live conference.
“We would wait for information from partners, but there was a high variance to actuals and Finance didn’t like waiting 12 days for the numbers. So, we looked at how we could do a predictive model to move forward more quickly.”
In this case, ‘moving forward’ meant building detailed models of passenger and airline behaviour so the airport could better plan its services – moving away from the concept of managing ‘passengers’ and towards the concept of serving ‘customers’.
“We wanted to get down to the point where we could understand things by flight, carrier, and so on,” Tyler explained. “The smarter we were, and the more we knew about our customers, the more we could design and support and build for our customers in their customer experience delivery.”
Aiming to improve its analysis and predictive modelling capabilities, shortly after joining the airport in early 2012 Tyler and a team of analytics staff began a massive data-cleansing exercise to improve access to the contents of the airport’s data warehouse using IBM’s Cognos business-intelligence tools.
"There was disparate information everywhere, and most of the time, the airport wasn’t seeing 95% of the data… It was really quite frustrating: we knew this data was there, but the question was how we could start cross-pollenating it to get inside the numbers."
Examination of the data quickly uncovered many of the data-typing issues that plague any large organisation with multiple data sources: for example, Tyler’s team found data organised around seven different definitions of what a ‘passenger’ was – and each made sense in the context of the information to which it related.
“There was disparate information everywhere, and most of the time, the airport wasn’t seeing 95% of the data,” he continued.
“Customs data sits in Customs systems, baggage data sits in the baggage system, and carrier data systems stayed with the carriers, and it doesn’t get shared. It was really quite frustrating: we knew this data was there, but the question was how we could start cross-pollenating it to get inside the numbers.”
Better numbers
Getting inside those numbers took the better part of 2012, during which the team began improving the sourcing of data from the airport’s systems and its use for forecasting.
Four key sources of historical data – including detailed information on passenger numbers, flight information from the airport’s flight information displays, and others – provided a good base of data from which to start working.
Several months ago, IBM’s SPSS statistical package was introduced to improve analysis of airport statistics. The platform has helped improve the airport’s regular reporting, cutting the days-long reporting process down to pre-fabricated reports that can be run in four hours – which equates to around five days’ reporting work per year, compared with 36 days’ work in the past.
As well as providing faster analysis, the new analytics platform has been progressively tweaked by a team of business and IT specialists, with its forecasts compared with actual traffic flow, and other forecasts of passenger behaviour prepared using past methods.
“We’ve found vastly improved forecast accuracy,” Tyler said. “Five times out of the last six months, we were more accurate than our counterparts – and over the past 12 months we were eight times more accurate than they were.”
“As we better understand the flow of customers through the airport… we’ll be able to quickly address any issues. To be able to take this information, and put it in front of [management] with high-level graphical representations, has made our lives a lot easier.”
Accuracy is being measured and tweaked all the time, Tyler added: “If we’ve got 100,000 people a day going through the airport, a 1% variation on a month is around 30,000 people. We’re trying to get to a target of less than 5000 variation, and less than 500 per carrier. We’re not quite there on all of those, but doing pretty well.”
Improved accuracy is allowing Sydney Airport staff to better analyse and predict passenger movements – which in turn is helping inform business cases for such varied services as managing airport parking congestion, improving passenger lounge access, and optimising the flow of product through duty-free shops.
After three months of statistical modelling under SPSS, the intelligence project is starting to grow wings as other parts of the airport operation become aware of its potential to improve customer management and drive the development of new services and products.
“The airport moves very, very quickly,” Tyler said, “and as we better understand the flow of customers through the airport, and how we manage our customer interactions, we’ll be able to quickly address any issues. To be able to take this information, and put it in front of people’s faces with high-level graphical representations, has made our lives a lot easier – and made it simpler to get ideas through management.”
“It was really important that advanced analytic capability was available for the airport to leverage off, going forward – and we’ve only just finished this model. There are lots of other data nuggets going forward – but as Sydney continues moving towards being a ‘smart airport’ these are the tools we will be leveraging.”