Comprehensive RAID performance report

Introduction Storage is one of those things that we can never get enough of, both in capacity and in performance. This article is going to compare a large set of RAID performance data and perhaps debunk some storage myths. I ran a large set of tests for my Intel ICH8R hot-swap platform and compared it to other RAID solutions on the market. See gallery of performance numbers here. I also want to give a special thanks to Eugene of StorageReview.com, who let me use a large set of RAID performance data on other non-Intel RAID controllers. I've been a longtime fan of StorageReview.com, which offers in-depth storage articles and performance databases.
Hardware and software configuration:
- Intel DG965WH G965-based motherboard
- On-board Intel ICH8R Southbridge 6-port RAID controller
- Intel Core2 Duo E6600 2.4 GHz dual core CPU
- On-board G965 graphics
- 2 GB DDR2-533 RAM
- Four Seagate ST3500641AS-RK 500 GB 7200 RPM SATA-II HDD
- AMS DS-3151SSBK hot-swap pass through SATA cage
- See this blog entry for photos of this system
- Windows Vista x86 OS
- IOMeter for testing storage performance
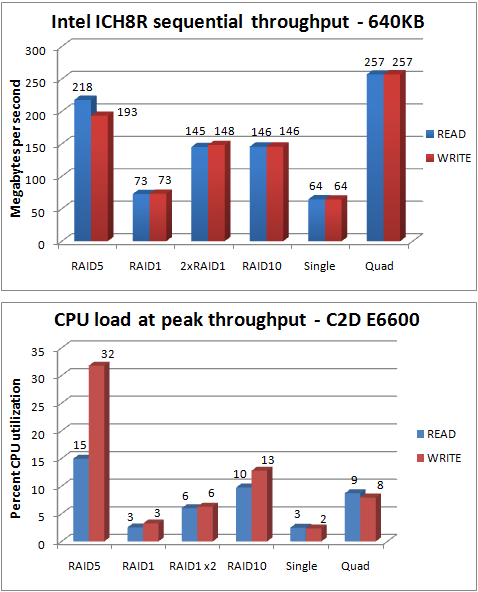
As you can see from the throughput chart, the RAID5 (with four drives), all out sequential performance is out of this world at 218 MB/sec (1.744 gbps) read and 193 MB/sec (1.544 gbps) write, which comes second only to "Quad," which is four standalone drives being driven by four independent workers in IOMeter. As you can see, there is a computational cost to pushing gigabit throughput with parity calculations. At peak RAID5 sequential write throughput, the Intel 2.4 GHz dual core processor is pushed to a whopping 32% CPU utilization. [UPDATE 1:45PM - Note that the high CPU utilization ONLY applies to all out RAID5 writes at a blistering 193 MB/sec. All of the server-oriented I/O performance benchmarks in the next few pages never caused the CPU to go above 3%.]
This would have been completely impractical before the era of cheap commodity dual-core CPUs, and it would have used almost all of the CPU resources on a Pentium 4 3 GHz processor. It used to be that to get any kind of decent RAID performance, you had to buy a hardware RAID controller costing hundreds of dollars. A decent 8-port RAID controller capable of delivering anywhere close to this level of performance would have cost about $300. But with cheap dual core processors from both Intel and AMD costing just over $100, the era of cheap, high-performance software RAID in the sub 8-port market is upon us. As Intel and AMD move quad core processors into the mainstream next year, we'll begin to see software RAID solutions threatening the hardware RAID business at 8 ports and beyond.
With a capacity of 1.5 terabytes in a cheap hot-swap configuration, this is a superb solution for a business or a home. 1.5 terabytes is enough to store a 250-movie DVD library or 119 hours of miniDV (Standard Definition Digital Video) or HDV (1080i High Definition Digital Video). This also makes a massive high-performance fault-tolerant file server for a business.
<Next page - Why RAID10 (0+1) superiority is a myth>
Why RAID10 (0+1) superiority is a myth
As much as we love raw sequential throughput, it's almost worthless for most database applications and mail servers. Those applications have to deal with hundreds or even thousands of tiny requests per second that are accessed at random on the hard drives. The drives literally spend more than 95% of the time seeking data rather than actually reading or writing data, which means that even infinite sequential throughput would solve only 5% of the performance problem at best. The use of extent-level striping in MS SQL Server allows even distribution of data and workload. The kind of storage performance that matters most for these applications is I/O (Input/Output) transactions per second, and it heavily favors read performance over write at a typical ratio of 80:20.The widely accepted assumption in the storage world has been that RAID10 (or 0+1) is the undisputed king of the hill when it comes to I/O performance (barring RAID0 write I/O performance because of unreliability in RAID0), and anyone questioning that assumption is considered almost a heretic within many IT circles. This is all based on the assumption that applications are incapable of using more than one storage volume at a time or that it shouldn't be done.
In my last career before I became an IT blogger last year with ZDNet and TechRepublic, I was an IT consultant, and storage engineering was part of my job. I worked with a Fortune 100 company that used SAP with Microsoft SQL Server 2000 on the backend. The SQL transaction times were getting so slow that they even considered building a whole new database server. I looked at the performance data and saw that the CPU never went above 10% utilization, and memory was nowhere near capacity. The choke point was the storage subsystem, which is almost always the culprit in database applications.
The storage subsystem was a high-performance SAN using a 20-drive RAID10 array comprising 10K RPM native fiber channel hard drives on a 1-gigabit FC (fiber channel) SAN. The knee-jerk assumption was that an upgrade to 2-gigabit would solve the performance problem, but I offered a non-conventional solution. The storage industry now pushes 4-gigabit FC SAN because that's the easy number to market. I knew that even during peak loads during the day, the raw throughput on the database server never exceeded 200 mbps, let alone one gigabit. The problem was the use of RAID10. I suggested using independent sets of RAID1, which was hard for the team to swallow, and it took some time for me to convince them to try it. It went against all conventional wisdom, but I was lucky to have a boss who trusted me enough to try it, and it was my neck on the line.
I replaced the massive 20-drive 10K RAID10 array with 8 pairs of RAID1 consisting of 16 15K RPM drives. The new 15K RPM drives had roughly a 10% I/O performance advantage over the 10K RPM drives they were replacing, but there were 20% fewer of the newer drives -- which meant that drive speed was more or less a wash. The biggest difference would be the RAID configuration. Microsoft SQL Server fortunately permits seamless distribution of its data tables among any number of volumes you can throw at it. The use of row-level extent-level striping in MS SQL Server allows even distribution of data and workload across any number of volumes, and I used that simple mechanism to distribute the database over the 8 pairs of RAID1.
[Update 7/28/2007 - Microsoft has corrected me that it's extent-level striping instead of row-level striping. An extent is a 64KB block of data which is the smallest unit of data.]
As a result of this change in RAID configuration, the queue depth (the number of outstanding I/O transactions backed up due to storage congestion) dropped a whopping 97%! This in turn resulted in a massive reduction in SQL transactions from a painfully slow 600ms per transaction to 200ms per transaction. The result was so dramatic that it was hard for everyone to believe it during the first week. They had thought that perhaps there was some mistake or anomaly and that this might be due to a drop in usage, but doubts subsided as time went on and the performance kept up. Even the engineer from the storage vendor who initially doubted the effectiveness of this solution became a believer after he ran some tests to verify that the load evenly distributed across the 8 RAID1 pairs.
But even with this success under my belt, it was always an uphill battle to convince other companies and their IT staff to consider using independent RAID1 volumes over RAID10. A big part of the problem was that Oracle lacked the ability to seamlessly split a table evenly over multiple volumes. It was still possible to divide up the location of the hundreds of tables that made up a typical database, but it required manual load measurements and manual distribution, which is something that many DBAs (database administrators) refused to do. It also required annual maintenance and a redistribution of tables because workloads change over time. Without extent-level striping, it becomes a question of whether the DBA and IT department want to deal with the additional management overhead.
For something like a Microsoft Exchange Server, you're required to have multiple mail stores anyway, so having multiple RAID1 volumes fits naturally into an Exchange environment. Too many Exchange administrators follow the RAID10 advice, and it results in a massive waste in performance.
The other major obstacle I had to overcome was the fact that most storage consultants believe in RAID10 (or even RAID5, which is horrible on write I/O performance) because this was conventional wisdom and they weren't in the mood to listen to my heresy. So instead of trying to argue with them, I'll just present the following quantitative analysis comparing the various types of RAID.
<Next page - Performance comparison of various RAID type>
Performance comparison of various RAID types
Read I/O performance with the Intel ICH8R controller
[Update 5/5/2007 - Note that this image and the next 3 images were updated. I had to shift the results for 2xRAID1 to the right by a factor of 2 and shift the "four drives" result to the right by a factor of 4. This is to account for the fact that I had 2 and 4 times more threads (more IOMeter workers) than the other single volume results, which is the equivalent of 2 and 4 times more depth on the outstanding queue. This didn't change the standings but narrowed the gap in performance.]
As you can see, 2xRAID1 (two pairs of RAID1) and four independent drives are the fastest I/O performers. The red and blue lines actually run so close together that the red line blots out part of the blue line. The four drives were put there for reference only, since you wouldn't actually use it in a server environment for lack of redundancy. 2xRAID1 achieved the best scaling while losing half the capacity to redundancy. RAID10 was a distant runner-up, and RAID5 was the worst 4-drive RAID solution. The orange line on the bottom merely shows the baseline performance of a single hard drive. It's clear that independent sets of RAID1 beat every other type of RAID, so long as you can make use of the additional volumes, which is trivial for most server applications. This is why my 8-pair RAID1 solution for that Fortune 100 company had such dramatic results.
Write I/O performance with the Intel ICH8R controller

When it comes to write performance, 2xRAID1 came in as the best 4-drive RAID solution again, and RAID5 was a distant last, dipping far below single-drive performance. If you're wondering why RAID1 has just over half the write I/O performance as read I/O, it's because RAID1 allows individual drives in the mirrored pair to read information while write operations must be synchronized.
Comparison of 4-drive read I/O performance

This chart shows the Intel-based ICH8R solution flying high above the pack when two pairs of RAID1 are used. Note that this particular chart includes the use of "half stroking," which is only the first half of the drive platter being used. The half stroking is responsible for part of the performance game but boosted the results by only roughly 18%. The ICH8R running RAID10 configuration is nearly identical to the other RAID controllers, and you can barely see its line hidden behind the 3Ware performance line. I used this half-stroked 2xRAID1 configuration to illustrate the maximum potential in a production environment. When we go to an 8-drive or 16-drive comparison, the difference in performance between the independent RAID1 pairs and the single-volume RAID array grows even wider.
Note: The previous charts used 32KB read/write I/O transactions, whereas this chart and the charts below use the "File Server" data pattern. The File Server pattern uses 512-byte to 128KB but most heavily weighted toward 4KB transactions.
Comparison of 4-drive write I/O performance

In write performance, the delta is even greater, and independent RAID1 sets continues to excel. One thing that stands out in this chart is the fact that the Intel ICH8R controller in RAID10 is far ahead of the pack running RAID10. Note that these numbers may not be directly comparable since I didn't run the tests on the LSI, 3Ware, and Silicon image controllers, and they may not have had WriteBackCaching turned on.
<Next page - RAID controller comparisons>
RAID controller comparisons
This page contains a mix of my data and data from StorageReview.com for non-Intel controllers.RAID10 File Server read I/O performance
This comparison shows how RAID10 performance between the four controllers is nearly identical.
RAID10 File Server write I/O performance
Intel seems to spike up above the pack for write performance. This may be due to WriteBackCaching, which benefits the Intel ICH8R on RAID0, RAID10, and heavily benefits RAID5 throughput. WriteBackCaching actually harms RAID1 sequential throughput performance.
RAID5 File Server read I/O performance
Intel ICH8R RAID5 performance was excluded because the File Server pattern wasn't run for this test. The 32KB results for the ICH8R are slightly below the rest of this pack but would have probably had similar results if a File Server pattern was used.
RAID5 File Server write I/O performance
Intel ICH8R RAID5 performance was excluded because the File Server pattern wasn't run for this test. The 32KB RAID5 write results are still significantly higher on the ICH8R, but that may be due to the WriteBackCache.
<Next page - LSI Logic, and 3Ware, and Silicon Image RAID performance>