Facebook ad rates surge 41%

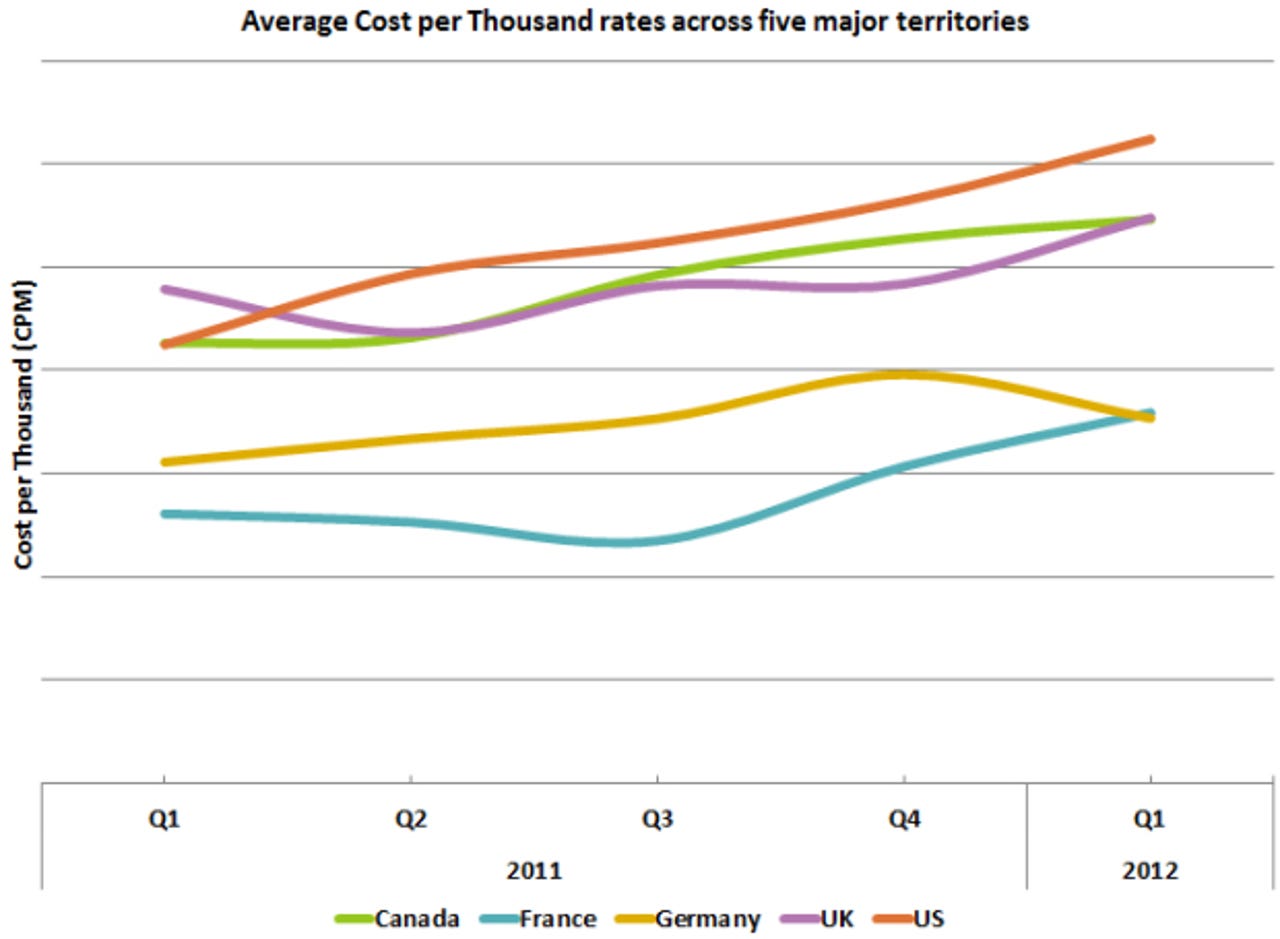
Facebook's average Cost per Thousand impressions (CPM) has increased by 41 percent between Q1 2011 and Q1 2012. In other words, Facebook is earning more from its ads. More specifically, average CPM rates have increased by 15 percent in the last quarter with the U.S. seeing an increase of 11 percent and the U.K. seeing an increase of 13 percent.
The data comes from a study based on 372 billion impressions in more than 190 countries for 235 clients, according to the 10-slide Global Facebook Advertising Report Q1 2012 by TBG Digital, which was also verified the University of Cambridge. The firm noted this is the last piece of major Facebook advertising performance research that will be released ahead of the social networking giant's $5 billion initial public offering (IPO) (expected to happen next month).
Additional findings from the report include:
- Click Through Rates (CTR) are up for news clients. With the huge success of Facebook social readers from the likes of Yahoo! News, The Washington Post, and The Guardian, CTR for those in the news sector since Q4 2011 has increased 196 percent. TBG argues this jump demonstrates that Twitter no longer dominates as the sole social network for news (see Americans choose Facebook over Twitter for news).
- Facebook Cost per Click (CPC) has increased by 23 percent in the top five territories versus Q4 2011, indicating that while growth in new users may be slowing (see Top 10 countries in Facebook adoption: December 2011), the social network is becoming more attractive to advertisers.
- The U.S. experienced a reduction in average CTR of 8 percent this past quarter with the top five territories seeing an average decrease of 6 percent, which could be attributed to an increase in the number of ads being placed on users' pages. CTR is generally a measure of how engaging users find a given ad, which is typically affected by how creative and appropriate it is.
- Seasonal deviations can contribute to Facebook CTR increases and decreases in certain vertical sectors. For example, Fitness is always a focus in a New Year where as Retail drops after its heights in the holiday season.
- The Retail sector has taken the lead on number of impressions served increasing its share by 10 percentage points to make up 23 percent of all impressions in Q1.
- The Finance sector leads with the most expensive advertising costs, with 3.5 times higher CPCs than the Food & Drink sector which has the lowest ad costs.
- The top 5 sectors continue to dominate; they comprise 78 percent of impressions served, out of the 18 sectors measured.
- On average, Cost per Fan increased 43 percent in Q1 2012, compared to Q4 2011. The U.K. saw the greatest jump with 77 percent followed by the U.S. with 37 percent.
- In Q1, Facebook continued to incentivize advertisers to stay within the Facebook environment by offering reduced CPCs of up to 45 percent.
"The recent Facebook Advertising Report unearthed some compelling trends as it relates to how brands are using the site to engage customers," TBG Digital CEO Simon Mansell said in a statement. "One amazing finding is that Facebook has seen an increase in pricing at the same time when it has also grown the number of ads per page, sometimes up to seven, which you would naturally expect to actually deflate prices. Additionally, the rapid increase in CTR for news clients is promising for Facebook as it demonstrates that the platform works well for sharing news as well as gaming and photos, an offering which other social networks, such as Twitter have dominated to date."
See also: