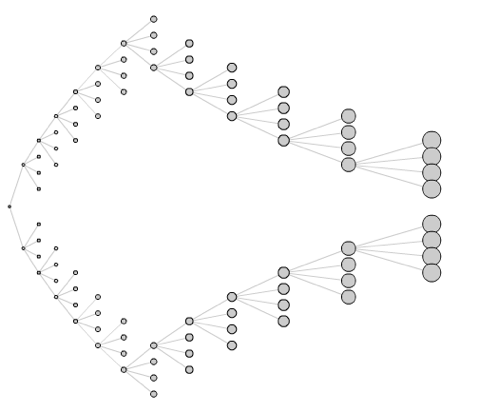
Flare data visualization library

I've been playing with Flare, an ActionScript library for creating basically any kind of visualization you want from graphs/charts to interactive graphics. It's a great example of being able to use an RIA technology for exactly what it excels at - powerful graphics. What's great about Flare is that it's open source and plugs into any Flash application pretty easily. Taking a look at the samples will take you on a tour of various animated visualizations that are a great way to show off almost any kind of data.
Even if you're staunchly in the Ajax/HTML camp, data visualizations are a great way to incorporate some plugin-based functionality into your applications. As far as HTML and JavaScript have come, they still can't come close to this kind of valuable data visualization. It looks like there was even some interest by Dojo in creating a JS interface to Flare.
