Google Maps: Street View cars could soon reveal how polluted your neighborhood really is

Google Maps plots pollution hotspots correlated with routes frequently carrying heavy-duty and medium-duty truck traffic.
Google has released its first block-by-block map of air-pollution levels, captured with mobile sensors hitched to its Street View cars.
The new pollution map is the result of a year-long project with the Environmental Defense Fund and Aclima, which makes sensor networks. Google's vehicles were equipped with these monitors and sampled each street in areas of Oakland, California, about 30 times over the past year to get a picture of the effects of 'hyperlocal' pollution.
The project aims to fill gaps in air-quality data collected by the three stationary monitors in Oakland operated by the Bay Area Air Quality Management District. It has a total of 15 in the Bay Area.
While we're used to seeing Maps displaying traffic congestion, the air-quality map offers a view of streets with different concentrations of dangerous particles, including black carbon, nitric oxide, and nitrogen dioxide.
Zooming in on the map illustrates specific streets and pockets where pollution collects, often near homes, schools and community centers. The street-level data is at a 30m/98ft scale and covers an area of about 30 square kilometers, or 11.6 square miles.
The data revealed that pollution patterns, attributable to local sources, can vary by five to eight times within individual city blocks, according to a paper by a group of researchers led by University of Texas of Austin researcher Joshua Apte.
"Since local variation in air quality profoundly impacts public health and environmental equity, our results have important implications for how air pollution is measured and managed. If validated elsewhere, this readily scalable measurement approach could address major air-quality data gaps worldwide," the paper notes.
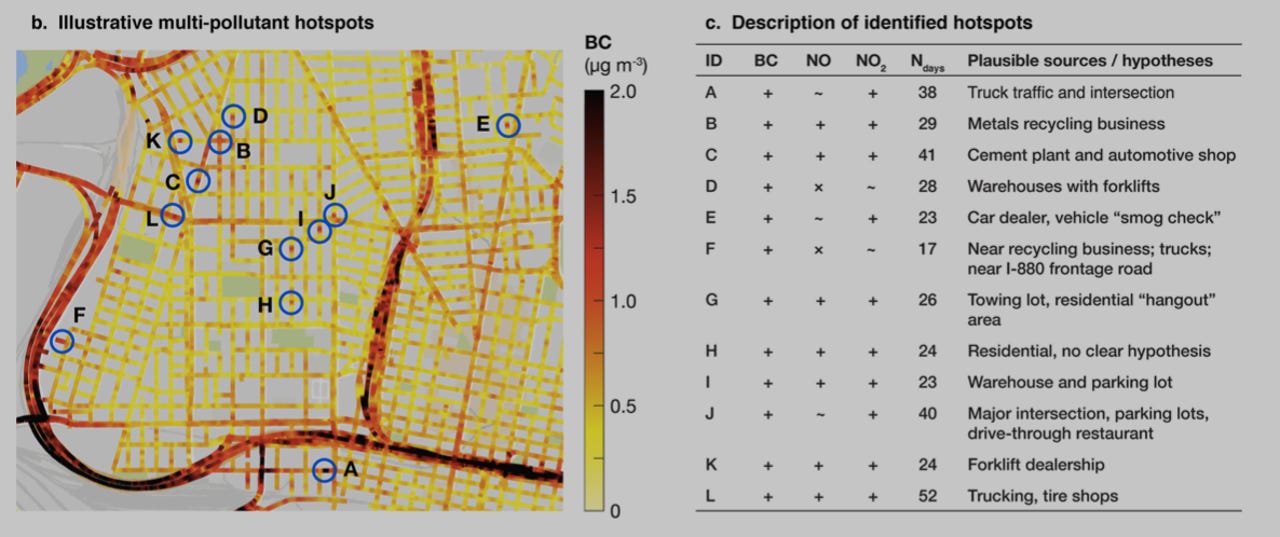
The data turned up specific hotspots where multiple pollutants far exceeded ambient levels. The researchers attributed the higher concentrations to plausible causes, including intersections along a major truck route, vehicle-repair facilities, and industrial sites with frequent truck traffic.
The researchers believe mobile air-quality measurement can be scaled further since spatial patterns can be observed accurately with fewer drive times. Future studies may also use other fleets of vehicles, such as public transport, delivery vehicles and taxis.
While it could be expanded to other cities around the world, the researchers estimate that 500 vehicles could map 25 of the largest US urban areas, covering a third of the total US population.
Scientists can apply to Google to request access to its air-quality data.
More on Google
- Chrome 59 is out: Bug fixes, native macOS notifications, Windows 10 Action Center support in the works
- Google faces $9b antitrust fine from EU Commission: Report
- Sick of ads? Now you can pay Google not to see them, plus sites can charge ad-blocker users
- Google names 42 Android devices with users running security updates from last two months
- Google's spreadsheet editor Sheets gets more machine learning features
- Android creator Andy Rubin launches his modular Essential phone