Tech's war on drugs: How big data is being used to fight the US opioid epidemic

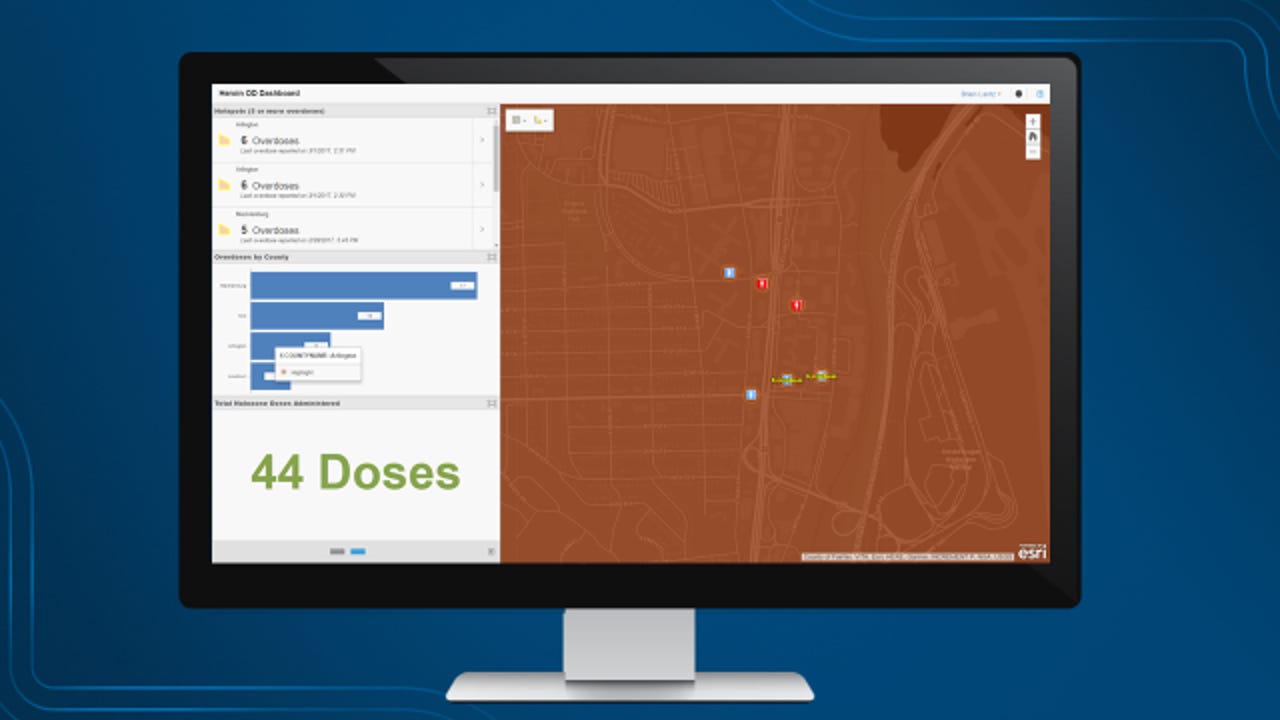
An image from OD Map. Image: Esri
Big data is being used to prevent and treat drug overdoses in regions across the US via a real-time app that's being used by the High Intensity Drug Trafficking Areas (HIDTA) program in Baltimore and Washington, DC.
The app includes a real-time overdose map, called the OD Map, and it was created by Esri to allow law enforcement, health care providers, and multiple jurisdictions across the country to see, in real time, where overdoses are occurring. It is, essentially, digitally transforming how the drug epidemic is being handled. HIDTA has been in existence since 1988, and this is the first time it has had access to a real-time map to share with jurisdictions across the US.
"One of the things that we have had a great deal of difficulty getting from the various agencies is data that's accurate and timely enough that we can mount some type of response. What we found with OD Map is, not only is it timely, but for the first time in my experience of 40-some years, it also allows us to really forecast where these drug overdose spikes are likely to occur next so we can take proactive action," said Tom Carr, executive director of HIDTA.
OD Map is improving the efficiency and effectiveness of law enforcement and health care providers in treating overdoses, and is provided free of charge to participating agencies, Carr said.
Why it matters
Drug overdose is the leading cause of accidental death in the US, with more Americans dying from drug overdoses in a year than did during the entire Vietnam War. In 2015, there were 52,404 lethal drug overdoses -- the highest level in at least 15 years, according to the American Society of Addiction Medicine. The New York Times reported that drug overdose deaths in 2016 likely exceeded 59,000.
Opioid addiction is driving the drug epidemic, with 21,101 deaths related to prescription pain relievers in 2015, and 12,990 deaths related to heroin that same year.
How it works
In the past, when overdose information came in, it could arrive weeks or months after the actual overdose took place. Now, with the OD Map, it's possible to see exactly where drug activity is the highest, and have doses of naloxone ready to be administered. Naloxone is an FDA-approved medication used to block or reverse the effects of an opioid overdose.
OD Map launched in January 2017, and only took 30 days to develop. With OD Map, public health officials and cities communicate through big data to allow for strategic and tactical collaboration among the 22,000+ federal, state, and local officers that work in HIDTA-funded task forces across the US and Puerto Rico, Carr said.
From OD Map's initial launch in January, through late August, there were 3,108 OD incidences reported through OD Map and 2,364 doses of naloxone administered, with 373 fatalities.
The technology relies on a geographic information system (GIS) to provide location data to first responders, who report overdose occurrences by entering the data on the OD Map dashboard. OD Map works on Windows, Android, iOS, and macOS devices using a standard browser -- Chrome, Firefox, or Safari.
SEE: How to build a successful data scientist career (free PDF) (TechRepublic)
GIS is an important aspect of OD Map because it provides an interoperable framework to share data across county and state lines, explained Chris McIntosh, director of national government industries at Esri. "This built-in interoperability allows information sharing at a previously unheard of level," McIntosh said.
The multi-jurisdictional information is invaluable to users, said Jeff Beeson, deputy director of HIDTA.
"If you are a suburb of Baltimore city, you've got the opportunity to see what's going on in Baltimore; oftentimes some of these large cities -- LA, Chicago, Boston, Philadelphia -- the drugs are being trafficked in the surrounding counties from that city, and knowing when overdoses are occurring from one jurisdiction to the next will help you better prepare yourself," Beeson said.
The agencies can now see real-time data for the entire country and can see where overdoses are spiking and spreading. HIDTA is currently using OD Map in 15 states and more than 50 local jurisdictions, incorporating about 165 public health and public safety agencies. It operated in a pilot phase until May, when it was opened up nationwide. More agencies and jurisdictions are being added weekly.
"Keep in mind that this was built as a public health database," Carr said. "It's not a law enforcement database. It's public health. We wanted to help public health track overdoses as you would a communicable disease because a substance abuse disorder is a disease of the mind and the body. It is not people making bad moral choices. These people are sick, so it's our intention to help prevent both fatal and non-fatal overdoses and get these people into some type of treatment program. This is pretty revolutionary because this is really the first time that law enforcement and public health has worked together in a concerted effort. One of the major groups that we have working with us on this project is the Centers for Disease Control and Prevention."
Beeson said: "We really love the fact that we do have that cross-jurisdictional functionality and we have sort of an early alert system in place for some rural counties that would otherwise be closed off from communications. OD Map is a methodology that creates information sharing, it creates a connection between jurisdictions and provides the ability for them to talk and address this issue, and start making the overdose epidemic the forefront of their public health agenda."
Also see
- Sleepbus using data to help homeless Australians get back on their feet (TechRepublic)
- Data-driven nurses ask for a voice in Australia's digital health strategy (ZDNet)
- Learn these 3 languages now if you want to become a data scientist (TechRepublic)
- Data to decisions: New trends in leveraging analytics (ZDNet)
- Building a big data solution? Here's why it's important to consult users first. (TechRepublic)