U.S. Open and IBM: Analytics Grand Slam

I live in New York City and I grew up here too, and so this time of year is very special to me. Although I am in no way a major sports fan, I adore watching the (tennis) US Open, which is played in Flushing Meadows, in the New York City borough of Queens. At the end every summer since I was in high school, I have attended the Open and/or watched it on TV. Back in the 1980s, my dad's firm had a courtside box in Louis Armstrong Stadium (center court at that time) and each year my family got tickets there for a few sessions during the 4th round and quarter finals. As such, I got to sit three rows back from the action, watching the likes of John McEnroe, Jimmy Connors, Ivan Lendl, Bjorn Borg and others battle for tennis supremacy, and it is was quite the thrill.
I’ve always tracked the many brands that have held sway at the tournament. As such, I’ve had my eye on IBM for quite a while. The technology IBM has built around the Open has become more sophistcated each year. And as that technology has become increasingly accessible to individual fans, I’ve wondered more and more how it’s built. So I was a bit of a kid in a candy store this week when I got to interview John Kent, IBM’s Technology Manger for Sponsorship Marketing, who gave me the lowdown on IBM’s US Open technology features and infrastructure. I’ll work to convey here the information I gleaned from that briefing.
US Open on your iPad
IBM has been working with the United States Tennis Association (USTA), the organization behind the US Open, for 22 years now. For that entire time the company has been providing infrastructure for delivery of scoring and statistics, but in the last few years, things have become especially interesting.
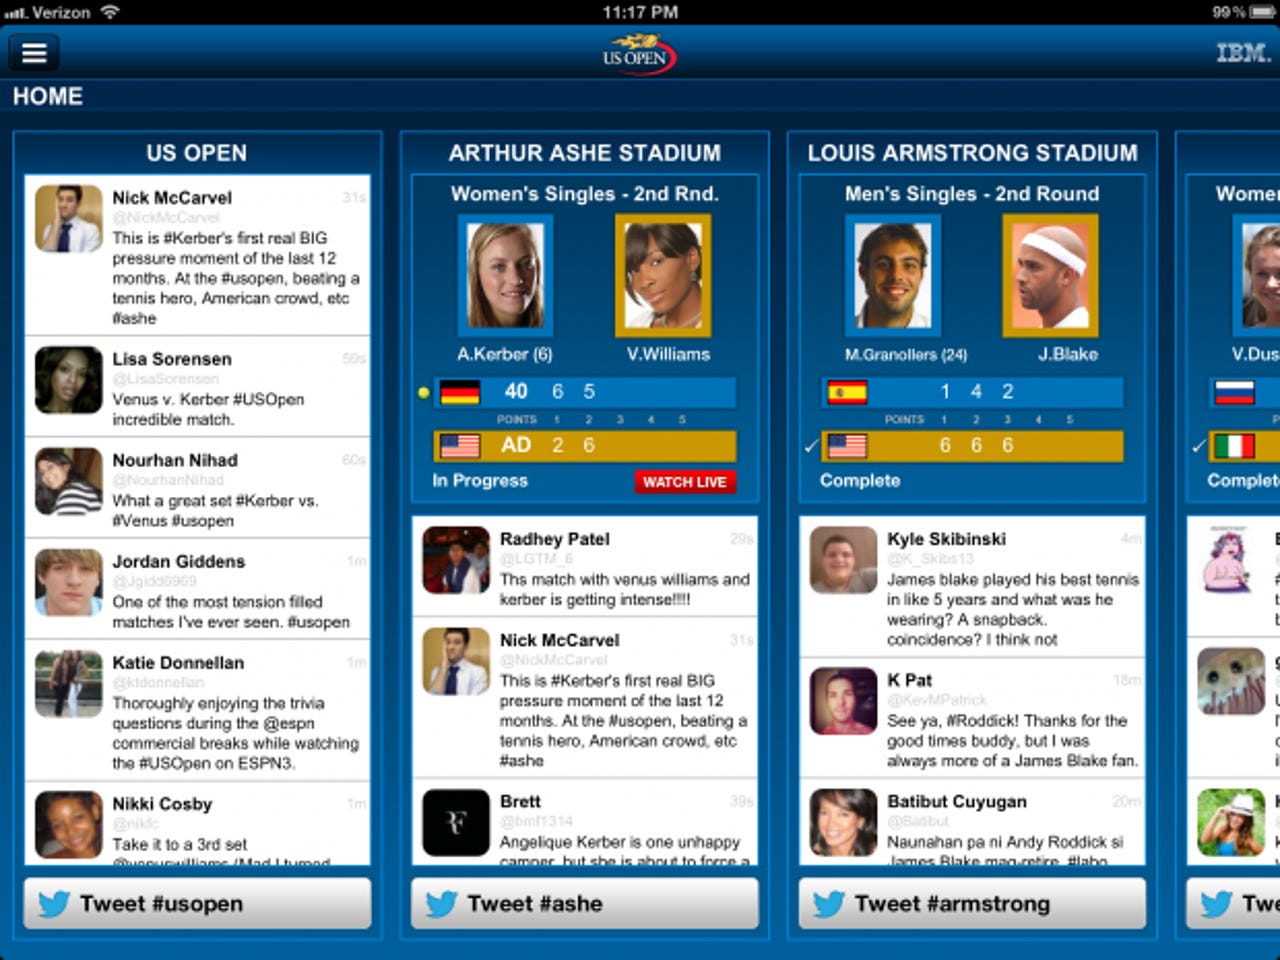
For example, this year, for the first time, the US Open has its own iPad App (the iPhone app came in 2009), which mashes up scoring information, live and on-demand video and analytics. There’s even a sophisticated social media angle: when the iPad app open you’ll see a collection of columns, each displaying a stream of tweets that are hash tag-specific to an individual court (and match) at the Billie Jean King National Tennis Center, where the Open is played.
With just a couple of taps, you can navigate a menu of video streams – also court-specific – which deliver live tournament play, in high-definition of course. You can also easily see the up-to-date draw sheet for all five major tournaments (men’s and women’s singles and doubles, as well as mixed doubles). I was using the app quite a bit in my beach house rental on Fire Island this week, where DSL (with downstream speeds below 3 Mbps) is the only broadband option, and the feeds performed well.
Back to The Web
You don’t need an iPad to take advantage of the technology though. For example, just head over to www.usopen.org on your desktop or laptop computer, and you’ll have access to most of the same features and even a few that you won’t get on the iPad. For example, select VIDEO & RADIO from the top nav bar, then pick US Open Live from the drop-down menu, pick a court, and watch the feed. As I write this I’m watching Angelique Kerber and Venus Williams play their second round match. Since I’m on a computer, I don’t just want to watch the linear video and listen to the color commentary; I also want to do some data analysis superimposed over the live video stream. As you might expect, IBM hasn’t let me down.
First off, I can click on the Match Stats button and see real-time updated statistics for figures such as first serve percentage, number of double faults and unforced errors, and I can see these numbers calculated for the whole match or a particular set. Towards the upper-left of the screen, there’s a button labeled “Keys to the Match.” If I click it, some very interesting data comes up. This feature, which premiered during last year’s Open, can determine the three most important factors in determining victory in a given match, customized for each particular opponent. You can see that same data on its own (rather than as an overlay on the live video) in the site's SlamTracker feature, available under Scores & Stats:
These measures also include goal and status amounts. In effect, they are key performance indicators (KPIs), and the Keys to the Match display is a scorecard, bringing the use of that term full circle, back to competitive sports. But rather than straight Online Analytical Processing (OLAP), these KPIs are derived from performing predictive analytics on the last 7 years’ worth of data from all four grand slam events, totaling 39 million data points.
The analytics favored Kerber through most of the match, and she was ultimately victorious. Although Kerber has a higher ranking than Venus, the results of the match were somewhat of an upset, which the IBM analytics correctly predicted.
This is really valuable data and IBM works with ESPN to supply the latter's on-air commentators with that data to keep the conversation moving. But the neat thing is – in this age of the Web and interactive analytics – you no longer need to rely on the commentators to get it. Instead, you just need a browser and a mouse -- or an iPad and your finger -- to be your own Grand Slam data analyst.
What’s behind the curtain
About two eweeks ago, I wrote a post on IBM’s Big Data prowess, including its product portfolio and the acquisitions that have filled it out. So naturally, I was interested to know what back-end IBM products and technologies are in use at the U.S Open. Here’s what I learned:
- The SlamTracker technology (which includes the match stats and Keys to the Match) make heavy use of the SPSS technology that IBM acquired in 2009.
- IBM’s stalwart relational database, DB2 is used heavily for scoring data and operations.
- WebSphere MQ (fka MQ Series), IBM’s foundational message-based middleware is used for scoring delivery, enabling you to get scores even more quickly online than you can over the air.
- The WebSphere family of technologies is used for the overall services architecture.
What’s most interesting to me about the above list is how all of the technologies in it are more than 10 years old (some of them well more). Core statistical, relational, SOA and middleware technology has not become less important in this age of data and analytics. And what’s especially noteworthy is that Hadoop, Netezza and Cognos Business Intelligence technologies haven’t even made the cut. Hadoop, Data Warehousing and BI are of course important; but IBM’s application of conventional enterprise technology shows that Big Data- and BI-specific technologies are not necessarily prerequisites for good analytics implementations.
More to Come
I’ve shared a couple of screen grabs with you here, but there’s more to come, including some photographs from the USOpen.org Operations Center and more from the site and the apps themselves. Look for that post ahead of the tournament’s final weekend so you can get yourself set up for multi-mon, multi-device analytics in time for the semi-finals and finals.