ZDNet Asia IT Salary Benchmark 2010

ZDNet Asia conducted an online survey between October 2009 and November 2010, to gain insights into salary trends and the IT workforce across the Asian region.
The study polled a total of 14,998 respondents from eight Asian economies--China, Hong Kong, India, Indonesia, Malaysia, the Philippines, Singapore and Thailand--and across various sectors including government, education, manufacturing, legal and finance.
| Number of Respondents | |
| China | 389 |
| Hong Kong | 543 |
| India | 7,646 |
| Indonesia | 1,269 |
| Malaysia | 1,136 |
| The Philippines | 1,995 |
| Singapore | 1,570 |
| Thailand | 450 |
| TOTAL | 14,998 |
| * polled from October 2009 to November 2010 | |
Conducted yearly, the ZDNet Asia special report profiles salary benchmarks and identifies skills and markets that command some of the highest pay packages in the region.
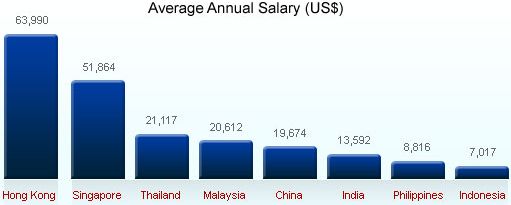
This year, IT professionals in Hong Kong once again led with the highest average annual salary of US$63,990, though this figure dipped from last year's US$66,140.
Singapore IT professionals once again ranked second at US$51,864, but unlike their Hong Kong counterparts, their 2010 annual pay package marked a climb from last year where they pulled US$45,341.
IT professionals in Thailand ranked third at US$21,117, followed by the Malaysians at US$20,612.
The average annual salary across the eight Asian markets clocked at US$25,835 with work experience averaging at 7.7 years.
IT professionals were also the most certified in Hong Kong, where 42.7 percent of respondents had at least one IT certification. They were followed by their counterparts in Singapore, 39.3 percent of whom were armed with at least one IT certification. India ranked in third at 38.4 percent.
Respondents with at least 1 IT certification
IT certification by proportion and ranking | ||
|---|---|---|
Rank | Country | Hold at least 1 IT
certification (%) |
| #1 | Hong Kong | 42.7 |
| #2 | Singapore | 39.3 |
| #3 | India | 38.4 |
| #4 | Malaysia | 37.7 |
| #5 | Thailand | 33.8 |
| #6 | Indonesia | 29.3 |
| #7 | Philippines | 27.6 |
| #8 | China | 27.5 |
Overall | 36 | |
Average annual salary by years of experience (US$)
Country | Years of experience | ||
|---|---|---|---|
Less than 5 years | 5-10 years | More than 10 years | |
| China | 12,150 | 21,649 | 35,118 |
| Hong Kong | 41,429 | 54,582 | 85,020 |
| Malaysia | 12,273 | 20,682 | 30,223 |
| Singapore | 31,749 | 48,601 | 70,335 |
| Thailand | 11,214 | 18,029 | 32,634 |
| Indonesia | 4,120 | 7,708 | 12,129 |
| India | 7,688 | 16,309 | 24,517 |
| Philippines | 5,945 | 10,095 | 14,511 |
Average annual salary by job function (US$)
| Country | Job function | ||||||
|---|---|---|---|---|---|---|---|
IT Management | Project Management | Systems Development | Communications | Support | Administration | Other IT Professionals | |
| China | 27,296 | 24,816 | 17,016 | 17,246 | 16,075 | 16,210 | 10,153 |
| Hong Kong | 93,087 | 67,149 | 46,013 | 50,280 | 42,688 | 59,134 | 61,975 |
| India | 22,901 | 18,977 | 11,664 | 9,794 | 7,382 | 9,591 | 13,073 |
| Indonesia | 13,090 | 8,550 | 4,353 | 5,851 | 4,418 | 5,538 | 6,194 |
| Malaysia | 28,752 | 24,509 | 17,111 | 16,698 | 12,432 | 17,524 | 24,141 |
| Philippines | 13,251 | 11,504 | 8,693 | 8,541 | 5,325 | 8,408 | 6,461 |
| Singapore | 76,737 | 55,394 | 39,293 | 49,254 | 35,855 | 43,349 | 55,450 |
| Thailand | 32,552 | 25,599 | 14,474 | 16,579 | 13,066 | 15,027 | 19,329 |
Select country to view related salary figures.