Measuring Windows 7 performance

I saw Windows 7 for the first time on October 26, 2008 at a press briefing just ahead of Microsoft’s Professional Developers Conference in Los Angeles. I had all of a day to use the pre-beta build and then stayed up most of the following night to have my first look ready for publication two days later.
Since then, I’ve personally installed, tweaked, and used beta and Release Candidate versions of Windows 7 on no fewer than 15 desktop and notebook PCs. At any given time, I have also had a dozen or so Windows 7 virtual machines running under three different virtualization platforms, plus a couple of Windows servers (one for business, one for home).
I began using what turned out to be the RTM build about a week before Microsoft officially announced that Windows 7 had been released to manufacturing on July 22. So, for nearly three solid months, I’ve been running the final, RTM version of Windows 7 on six desktop PCs and four notebooks here, using them for a variety of roles.
I’ll leave it to others to measure speeds and feeds for Windows 7 using their favorite benchmark suites. A comprehensive, controlled lab test takes a ton of resources and is an exhausting job. I’m looking forward to seeing who steps up for this job.
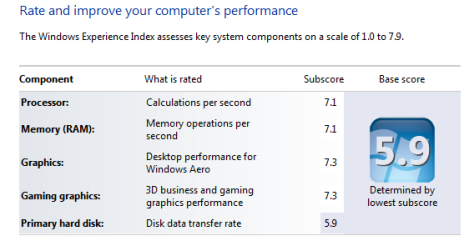
There is, however, one performance metric that is common to every Windows 7 system: the Windows Experience Index, or WEI. If you allow Windows to rate your system it runs WinSAT (the Windows System Assessment Tool), which is far more demanding than its Vista predecessor. It produces five numbers, one for each component of a subset of tests, and displays the results on demand, like this:

I recorded the WEI numbers for all 10 systems I’ve been using and arranged the results into the table shown here:
Microsoft’s scale for each test goes from 1.0 to 7.9. The numbers are generally comparable to those on Vista machines, where the top ranking was 5.9. I used Excel to color-code the values on this chart with a simple “greener is better, redder is worse” key. I sorted by the Graphics column, but the results would have been similar with other sort orders.
I didn’t look at these numbers carefully until near the end of my research, after I had recorded all my experiential observations. So I was curious to see how the numbers shown here line up with my experience. Can the operating system keep up with me? Are there hardware configurations that result in noticeable speed-ups or slowdowns in performance? Do any common tasks feel consistently faster or slower than they did on Vista or XP?
I’ll share more details from my lab notes on all 10 systems next week. But I thought this chart was worth sharing as a preview. Here are a few comments to explain what it shows:
- The oldest machine on this list was shipped in January 2007, just before Vista was publicly released. The newest system (a 2009 model Mac Mini with an NVidia 9400M GPU) just arrived today.
- Four are notebooks, three are small-form-factor desktops, and three are full size desktops. All of them perform acceptably for the job they've been assigned.
- None of these machines are particularly expensive. The two notebooks at the bottom of the chart (Lenovo and Sony) are review units, one of which has already been returned. I paid for the other eight out of my pocket. Six of them cost between $600 and $800, including all upgrades. The two that cost over $1000 are Media Center machines with expensive TV tuners (a total of three CableCARD tuners at an average of $250 each).
- Every machine on this list is upgradable (although the Apple Mini makes the process as difficult as possible). I’ve taken liberal advantage of that capability to add memory, increase hard drive sizes, replace video adapters, and add external peripherals such as fingerprint readers and TV tuners. Upgrading can extend the life of a machine dramatically.
- All of the systems on this list have Intel Core 2 CPUs. There are no i7 Core machines, nor are there any Atom-powered netbooks. The quad-core CPUs in desktop machines rate highest. The low-power Core 2 Duos in lightweight notebooks do worst on processor scores (but still perform just fine for their intended purpose).
- On graphics scores, the three worst-performing systems have integrated Intel graphics. The best-performing desktop has a discrete ATI video adapter; the best-performing notebook has an Nvidia combo display adapter with discrete GPU and integrated graphics that can be toggled to balance performance and power.
- Notebook hard disks can be a real bottleneck. Those 4200 RPM drives in some small notebooks are really slow. Most modern desktop drives, running at 5400 or 7200 or even 10,000 RPM, transfer data at rates that are similar enough to one another and will earn a 5.9 maximum. A solid-state drive is the only one that will rate above a 5.9, as far as I can tell.
As I mentioned at the start, I’ll have a lot more details for individual systems next week to help put this table into better perspective.
If you've got WEI details to share for a system running the RTM version of Windows 7, share them in the Talkback section below.