Analysis: Server Side Java energy efficiency versus load

With the arrival of the latest standardized energy efficiency benchmark from SPEC, we have a good way to measure server efficiency. In light of the recent controversy over flawed energy efficiency studies that have unfortunately been touted by so many in the press instead of SPEC, I thought I'd offer some more in-depth analysis on energy efficiency.
The new SPECpower_ssj2008 benchmark gives us a standardized way of measuring energy efficiency for Server Side Java. SPECpower_ssj2008 gives us efficiency data at varying workloads going from 0% to 100% at increments of 10%. Then it provides us with a Performance to Power Ratio curve along with an average efficiency of those 11 workload measurements. The two graphs below are compiled from the SPEC database. It represents the fastest Intel quad-core system (below left) versus the only AMD CPU submitted to the SPECpower_ssj2008 database to date which is a special energy-efficient Opteron 2216HE (below right).
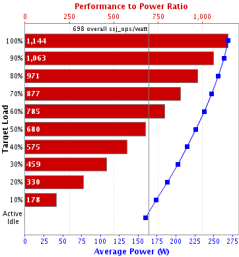
The two graphs above show more than a 3 to 1 advantage for the fastest Intel system when we look at it in terms of percent workload. This is a perfectly valid way of analyzing the data, but the tradeoff is that you're not seeing the efficiency of each processor at absolute workloads which might be valuable if you need a system with lighter workloads. So to offer an alternative method of interpreting the efficiency data, I plotted out the following Efficiency versus CPU capacity graph with published data from SPEC (and some MS Excel help from analyst David Kanter).
- DP = Dual Processor
- UP = Single Processor (Uni-Processor)
- QC = Quad Core
- DC = Dual Core
- FB = Fully Buffered
- "Operations per joule" is identical to ssj_ops/watt unit used by SPEC.
- "Operations per second" refers to Server Side Java performance.
The blue curve represents the Intel E5450 server shown in the SPEC "Performance to Power" chart above left while the cyan curve represents the AMD 2216HE system. You'll notice that the curves are somewhat close together at the lower workloads which means the AMD system is almost as efficient as Intel at lighter workloads. But at peak performance levels, Intel is three times faster than the AMD 2216HE system and more then three times the energy efficiency. So if you had to buy three of the AMD 2216HE systems to get the same Server Side Java capacity as the Intel E5450, it would cost you three times the power.
You'll also notice the pink curve spiking upwards in efficiency just shy of the absolute peak efficiency level of Intel's latest 45nm E5450 3.0 GHz quad-core CPU. This single-socket single-processor 2.4 GHz XEON X3220 Intel server is by far the most efficient system at lighter workloads. Had a newer single-socket CPU like the 45nm QX9650 3.0 GHz 45nm quad-core processor been used, the efficiency curve would probably fly off this chart. Intel's 5100 series "San Clemente" chipset will also get much better efficiency than anything on this graph because it uses lower power registered DDR2-667 memory like AMD.
<Next page - How to spot a flawed CPU energy efficient study>
How to spot a flawed CPU energy efficiency study
Now that we've gone through some thorough analysis on energy efficiency, let's look back to the flawed CPU study from Neal Nelson and associates. Upon further investigation, I found that not only is Nelson's test flawed in the sense that Intel's best players aren't included, but the test is fundamentally flawed.In a bastardized manner, Nelson's efficiency results actually look like my efficiency versus capacity graph but he chops off the right side of the graph with arbitrary performance caps. Since it's possible for a less efficient chip to get better efficiency at lower workloads, you can manipulate the graph to favor one vendor over another simply by playing with the arbitrary cap on performance.
Updated 1/25/2008 - To illustrate this problem with Nelson's efficiency study, we can look at Neal Nelson’s “published paper”. As you can see, Nelson is capping the performance of every machine to 2407 TPM (transactions per minute) for 100-user loads and 12036 TPM for 500-user tests. Nelson's TPM numbers are identical to within 0.1% deviation whether you're using a single 2GHz processor server with 1GB RAM or a dual 2.33 GHz server with 16GB RAM. That means the Intel CPU no matter how fast it can go will never be allowed to perform to its full potential. Nelson called me this week to explain that he doesn't cap the performance portion of his study which appears to be true, but that has no relevance to the efficiency portion of his study which are capped and are used to draw conclusions about energy efficiency.
This is like saying that a Boeing 737 is more efficient than an Airbus A380 at carrying 130 people and then declaring to the entire world that Boeing is more efficient than Airbus. But if you measured under the premise that you need to carry 525 people, the A380 will always be more efficient than four Boeing 737s in terms of passenger*mile/gallon but this critical detail is omitted in Nelson's report.
Takeaway You might conclude from this analysis that it's always better to buy the smaller computer system to run your business since it's more energy efficient and probably cheaper to acquire the hardware, but there are other factors to consider. For one thing software licensing often dwarfs the hardware costs so you want to maximize your software licenses in terms of performance. Another problem is that if you're talking about a transaction system and you occasionally need to go beyond the peak performance you've allocated for, are you prepared to turn away those transactions?
Lastly, it is usually cheaper to have idle processors than idle people. Having workers that sit around twiddling their thumbs while your server cranks isn't the best use of resources. If this were a customer facing system (directly or indirectly), you risk losing customers. You might only need X number of transactions per minute and you even provisioned a server with 25% overhead capacity, but that may still not be good enough. A server operating at or near capacity has very slow response times which may violate your SLA (Service Level Agreement) with your users whereas a server operating with 50% overhead can respond much quicker.
So at the end of the day when you factor in the need for responsive computer systems, IT departments will always buy the system that meets the worst-case workloads. Ideally those servers will be energy efficient at all workloads but your mileage will vary depending on how close you get to peak performance and it will depend on what you can tolerate in response times.