Jaspersoft 5.6 zooms in on developers with JavaScript analytics embedding

Jaspersoft says the latest version of its analytic software comes with a JavaScript framework that lets developers embed intelligent visualisations in web-based apps more quickly and with more control.
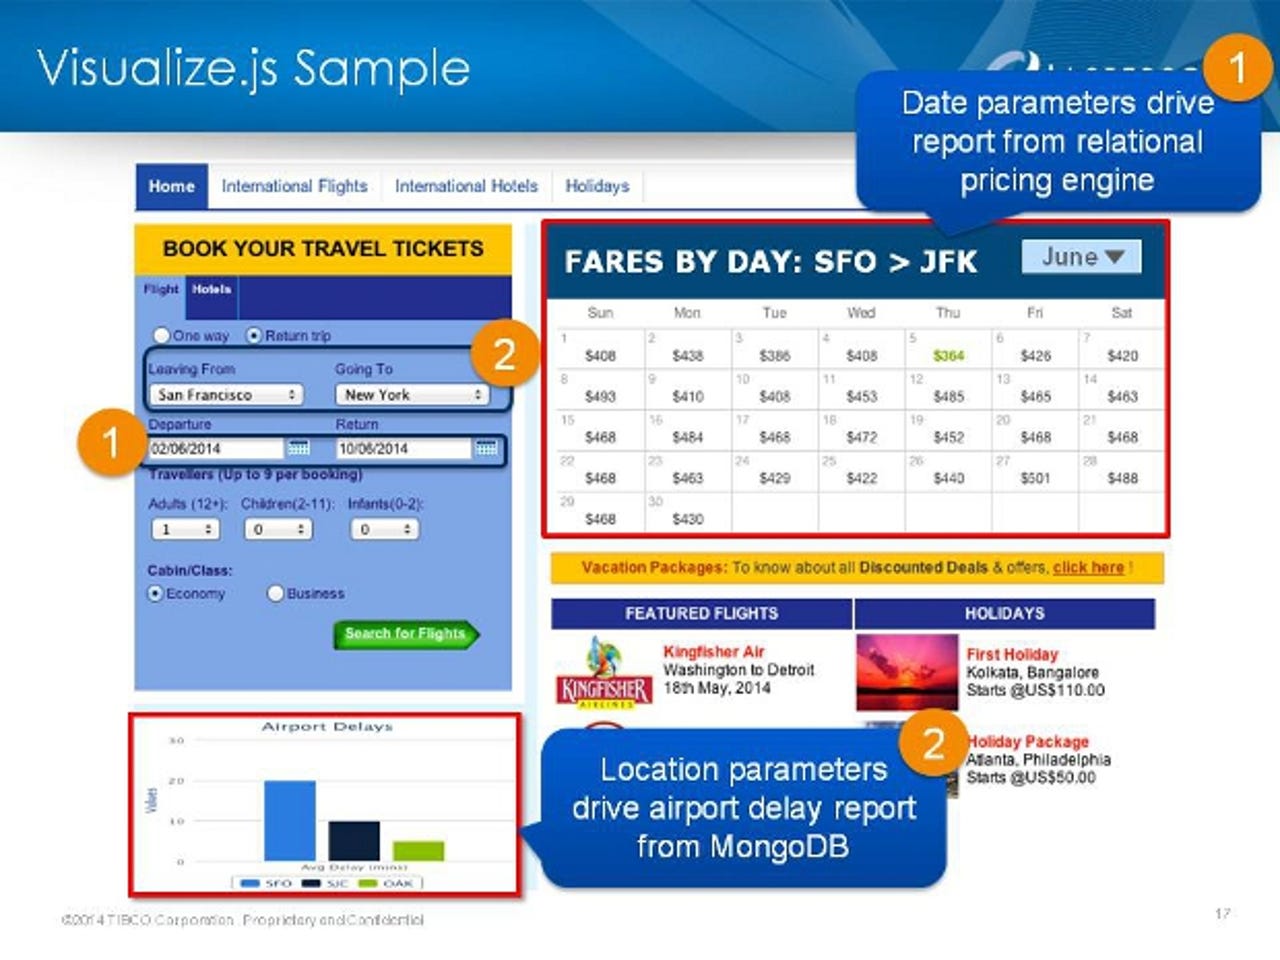
Jaspersoft 5.6 also offers federated query connectors to allow the virtual blending of relational data with data from major big data technologies — including Hadoop, MongoDB, and Cassandra — to help developers speed up prototyping and data inspection, the company said.
The Visualize.js API is a JavaScript-based framework that enables any web-based application to accept and integrate easily a visualised component built in Jaspersoft, according to Tibco Jaspersoft SVP Brian Gentile.
"Technically, you can think of it as a JavaScript-based wrapper that encompasses the visualisation and allows it to be embedded in another web application," Gentile said.
"Even though it's embedded in another web app, it maintains its interactivity and intelligence and in a sense a live link back to the Jaspersoft report server.
"So it provides this simplicity of integrated functionality but at the same time provides the developer with a high degree of control over the embedded visualisation."
Because there is a live link, when that data changes, the gauge, the graph — or whatever form the visualisation takes — changes. At the same time the user can be interacting with the data.
"The user gets all the interactivity they would get even if the gauge, graph or visualisation were just in the Jasper server," Gentile said.
"In other words, you can now zoom into the graph, turn off key parts of the data through the legend, sort and add columns — you can do all these interactive things that you would do normally if it were just a JasperReports Server gauge or graph, even though it's embedded inside another application."
Along with federated access to major big data sources, version 5.6 also has updated certified connectors to more recent distributions of Hortonworks, and Cloudera and Impala, as well MongoDB and Cassandra.
"Our federated query engine allows you to issue queries to multiple data sources simultaneously and then bring the results back and join them in memory. So the federated engine now includes the most popular data sources, especially Mongo, Hadoop, and Cassandra," Gentile said.
Tech Pro Research
In addition to new types of graph — including spider, bubble and scatter charts, and dual-level pies — Jaspersoft 5.6 also offers the ability to create custom calculations.
"You can apply logic to these different mathematical operations and you can create your own custom-calculated fields. This gives a rich set of extended analytic calculative functionality to build whatever is important in dashboards, reports and visualisations," Gentile said.
The final new element in Jaspersoft 5.6 is interactive reporting to improve the experience for companies that use Jaspersoft for production and operational reporting, where reports can be extensive.
"One of things we've done is provide report scaling so you can zoom and expand the size of the report to take up whatever screen real estate you have," Gentile said.
"We've also built a much more intelligent search function within the report so that we can now search on report content as well as report metadata, so that you can find the right report even among a vast library."
More on big data
- Hadoop 2.4 in preview for Azure users and more Microsoft cloud news
- Data science vs the hunch: What happens when the figures contradict your gut instinct?
- Big data creates storage security headaches for CISOs
- Cloudera buys big data encryption outfit Gazzang
- SAP's Plattner makes his case for HANA
- Hadoop big data analytics: Can SQL support bring it to the masses?