Business intelligence, meet graph. Neo4j introduces BI connector for data discovery tools

It was only a couple of weeks back that we introduced what was then the latest development in the graph database world. Graph databases and analytics are getting ever more accessible and relevant, was our opener. Well, they are, and vendors seem to be going through a virtuous circle of innovation.
Today it's Neo4j's turn to announce a new feature that lowers the bar for graph database adoption. Neo4j announced today the Neo4j BI connector, which it dubs the first enterprise-ready driver to bring graph data to the Business Intelligence (BI) market. The connector presents live graph datasets for analysis within popular BI technologies such as Tableau or Looker.
Although Neo4j worked with multiple customers as well as partners like EY to do extensive testing of leading BI and data discovery providers including Tableau and others, the announcement does not include partnerships with such vendors. As David Allen, Neo4j Technology Partner Architect told ZDNet, Neo4j will likely establish more formal partnerships in this area over time as a function of customer and market demand.
What the BI connector does, and why it's a win-win-win
Tools for data discovery and visualization are already quite common in the graph database world. Neo4j is no exception, as in addition to its own tools, it also integrates with an array of 3rd party tools. But the idea behind the BI connector is apparently to meet users where they are.
Tableau-like tools have a big user base, and making graph data available to users alongside their other data sources is a big win for everyone. Tool vendors offer an additional data source to their users, users enrich their insights, Neo4j expands its user base. Win-win-win.
Neo4j cites a recent Gartner report, recommending to "apply graph technologies to enrich multiple datasets with semantics and to automate or augment their unification across silos. This allows richer context provisioning and real-time situation awareness for continuous intelligence, all for better decision making."
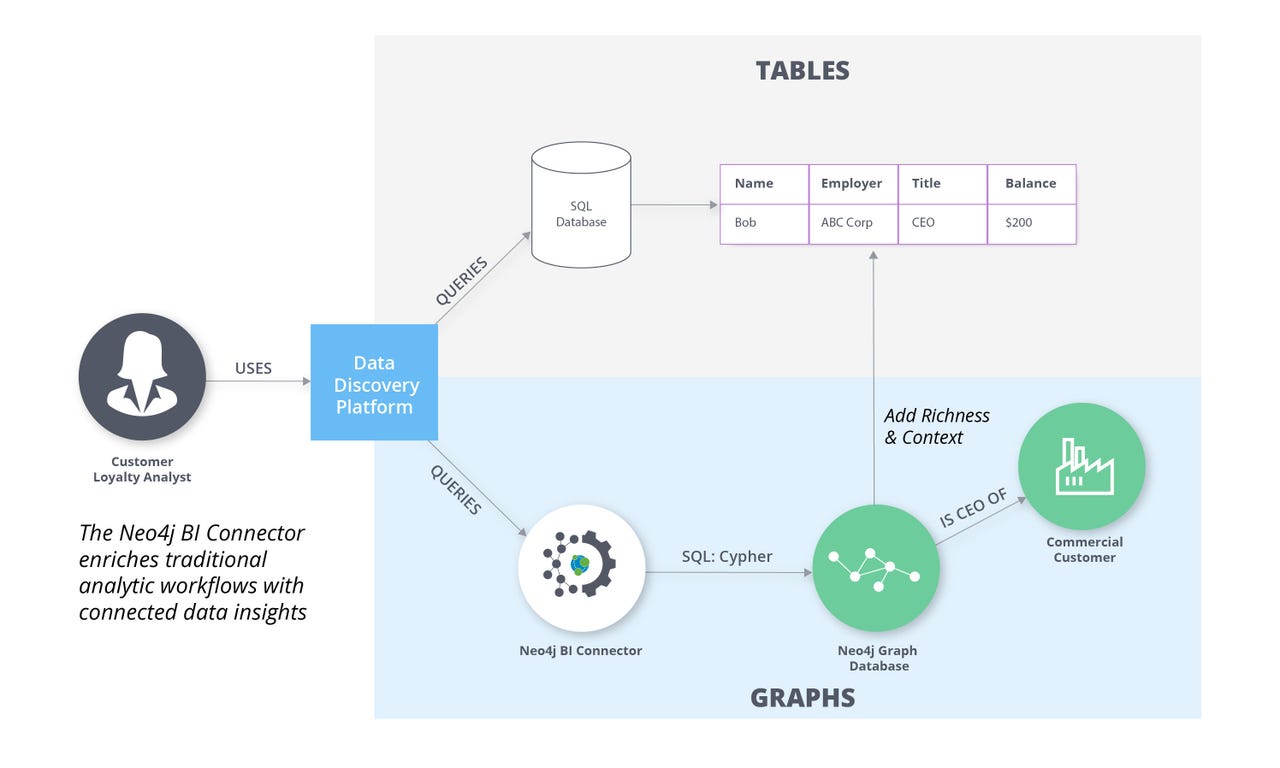
Neo4j's BI connector enables mixing and matching of graph data and relational through BI and data discovery tools. Image: Neo4j
Neo4j's press release notes the BI connector allows users to analyze graph data alongside traditional data stored in relational or NoSQL databases within familiar BI tools. It also allows users to create visualizations and dashboards that will help them to extract the hidden value in their data, serving to enrich their traditional SQL-based analysis. Some examples Neo4j mentions are deeper customer insights, and fraud analysis.
A BI analyst trying to understand customer value might identify an individual retail banking consumer as a relatively lower-value client based on a small personal bank account balance. By leveraging relationship information from Neo4j to connect commercial and retail banking data, the same consumer is found to be the CEO of one of the bank's largest commercial customers and therefore revealed as a high-value customer.
An investigator or analyst looking at a dashboard metric such as "Volume of Identified Fraud" in a given period might want to also understand how the fraudulent transactions in that period were related. By using the Neo4j BI Connector, they would be able to better understand how many instances were connected to a given fraud ring, how many were connected to a given bank branch or retail outlet, and more.
How does the BI connector work
The Neo4j BI connector is built on the JDBC (Java Database Connectivity) standard. It translates SQL into Neo4j's graph query language, Cypher. It removes the need for analysts to learn Cypher, or write code to access Neo4j. Neo4j notes the connector is fully supported for Neo4j Enterprise v.3.5 and above, and ready for production deployment.
Even though the connector leverages the JDBC standard, Allen clarified that it's not built on the existing Neo4j JDBC driver. The connector exposes a virtual relational schema for software tooling such as Tableau that expects a relational database, and which knows how to build & execute SQL queries, and is proprietary. It is recommended for business facing applications, where SQL is typically auto-generated.
The Neo4j JDBC project is an Apache 2.0 licensed open source project, and as such, community support via Neo4j's usual channels is available. It provides a JDBC-compatible interface for executing Cypher queries against a Neo4j instance and fetching results. The Neo4j JDBC Driver supports Neo4j 3.0 and forward, and is recommended for developer access, and ETL jobs, where tight control over Cypher queries is needed.
Interestingly, this work is informed by the ongoing standardization work for graph query languages. As Allen said, prior to the standardization efforts formally kicking off, there was some internal work on a mapping between tables and graphs that was called "Tables for Labels". The connector uses this approach, which exposes the entire graph in a relational schema without the user having to specify one.
In Neo4j there are no tables - only nodes and relationships in a graph. So what the connector is really doing is exposing a virtual relational schema that is built by the driver. One table per unique node label combination, and one table per relationship pair found in the graph are exposed.
A simple mapping from a graph to a relational schema. Image: Neo4j
In the above simple example graph, we have the labels Person and Hobby, and relationship types KNOWS and LIKES. Each label and relationship will get their own tables, forming "join tables" that, via SQL, can then be used to traverse relationships. The resulting relational schema is displayed below, divided into four total tables. The rows of data, and their data types, are shown as they would be translated from Neo4j:
On the fly, the BI connector takes an inputted SQL query and translates it into a Cypher query. The Cypher query is executed against the database just as any other query would be, and the results are sent back to the client. Here's a very simple example of how that translation might work:
SQL: SELECT name FROM Nodes.Person WHERE age > 20 ORDER BY age DESC.
Cypher: MATCH (p:Person) WHERE p.age > 20 RETURN p.name ORDER BY p.age DESC;
Relationship tables are more complicated, but follow the same principle. Relationship tables consist at a minimum of a source and target ID, which match the _NodeId_ field in a label's table. When tools generate SQL JOINs, they are effectively "traversing the graph" through a relationship.
The greater scheme of things
Neo4j's BI connector exemplifies a few key trends in the graph database space. First, the rapid pace of innovation. As we have been active in graph for a long time, we can attest to the fact that development in the last couple of years has greatly accelerated. Availability (mainly via managed cloud platforms) and accessibility (via integrations and no code / low code tooling) are, predictably, key concerns for vendors.
We posit funding plays a key role with regards to the pace of innovation we see from each vendor. Judging from funding rounds alone, it seems no coincidence that Neo4j and Tigergraph are releasing new versions, and features, so often. They recently closed funding rounds of $80 million and $32 million, respectively. That clearly helps with engineering, and marketing.
According to DB Engines, Neo4j is leading the graph database space in terms of mindshare. Emil Eifrem, Neo4j CEO, has recently stated that the company is not profitable today, though it could be, because "now is the time to invest". That helps explain the slew of new features we are seeing from Neo4j.
Meeting users where they are is what many graph database vendors are trying to do. Enabling access via BI tools is a good way to achieve this.
It's worth noting here, however, that Neo4j is not the first vendor to announce a SQL connector. A 3rd party connector can be used to query OrientDB, an open source multi-model database which also supports graph, via the KNIME platform. And Stardog, an RDF graph database, has announced a BI connector in Beta in October 2019. Graph vendors seem poised to expanding the set of languages through which they can be accessed.
Neo4j's Eifrem also emphasizes the importance of standardization. This highlights another important trend we see, related to today's announcement. Neo4j has been working on interweaving documents, tables and graph data at least since 2018. As Allen mentioned, the work on standardizing graph query languages is related to Neo4j's connector.
GQL is a graph query language standard under formation, going through the ISO committee's process. Since there already are at least 3 implementations of SQL-to-graph we are aware of, this may well mean that the way to do this could be standardized, and become part of GQL. As Eifrem put it:
"GQL means that if you are a CIO then you can write your applications using GQL and while it's never 100% interoperable between vendor products you'll probably get to 95-plus. That's a huge deal if you're a CIO in terms of skills they can access and investment in training your developers on GQL, knowing fully well that it can work on Neo4j and on other graph interfaces too".