Ecolab: Leveraging Advanced Analytics in the Cloud
Introduction
Big data analytics has been a popular buzzphrase for the past several years. With the explosion of data available from customer interactions, transactions, support calls, and social media - just to name a few sources - companies have been struggling valiantly to store vast quantities of information and, most importantly, how to derive value from it.
The Internet of Things (IoT) has compounded the challenge by adding data feeds from connected sensors and devices. These feeds may contain a treasure trove of actionable insight, if companies can sift through them in real time and achieve the agility to act on them quickly.
Cloud computing has helped solve the storage and processing challenges inherent in big data and IoT analytics, with its near-infinite scale and pay-as-you-go pricing models. Market research conducted in recent months bears out this trend.
In October 2016, International Data Corporation (IDC) predicted that worldwide revenues for big data and analytics will grow from $130.1 billion in 2016 to more than $203 billion in 2020. IDC also found that spending oncloud-based big dataand analytics solutions will grow 4.5 times faster than spending for on-premises solutions. The reason, according to IDC's 2016 Futurescape Report: "Complexity of managing on- and off-premises data and technology is going to increase and the number of internal and external data sources and types will continue to increase."
This prediction has certainly proven accurate at Ecolab, a global leader in water, hygiene, and energy technologies and services. With its North American operations based in St. Paul, MN, Ecolab serves businesses around the world, specializing in food services, hospitality, healthcare, industrial, and oil and gas companies. Ecolab provides a broad suite of technologies, automated monitoring systems based on sensors, data analysis, chemical solutions and expertise that helps customers minimize freshwater use, maximize performance and optimize total cost of operation while also keeping the environment clean and safe.
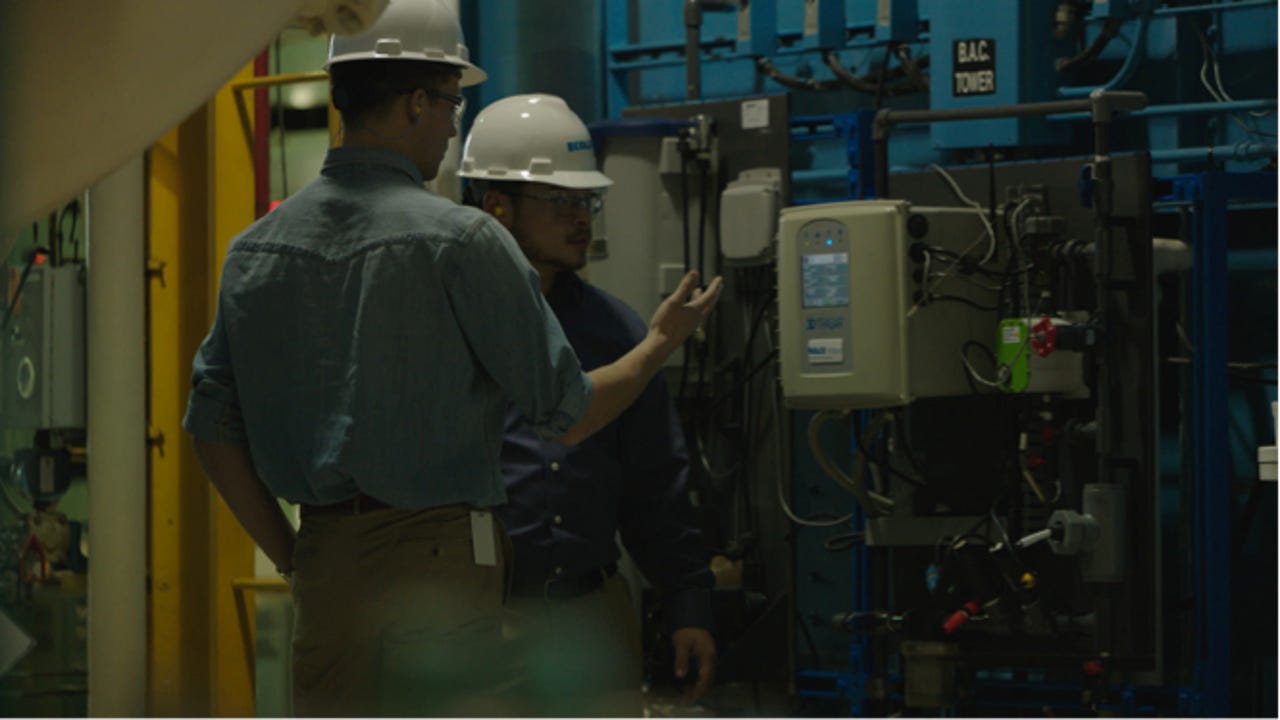
In this report, we'll hear from the IT professionals at Ecolab, in their own words, about their experiences with moving Ecolab's analytics infrastructure into the cloud.
A Global Network of Sensors
Ecolab's vast pool of data includes information from many different sources, but its primary sensor network is part of their 3D TRASARTM Technologies for Cooling Water, Boilers, Dissolved Air Flotation and Membranes.
"3D TRASAR is a technology that actually was developed back in 1988," explains Kevin Doyle, vice president of Global Digital Solutions at Ecolab's Nalco Water business. "At the time, it was about tagging chemicals in the water so that we could take readings in real time and optimize the performance of our customers' operations in their cooling towers, boilers and other systems."
The hardware involves connected sensors, controller units and gateways that send information back to Ecolab, he adds. "There are probes in the water stream that are collecting data, to the tune of about 28 billion data points a year that we collect across 36,000 systems that we've deployed at customer sites."
3D TRASAR monitors chemicals in large-scale water systems.
Depending on the readings, automated systems regulate the 'dose' of chemicals needed to keep the water clean and flowing efficiently. "3D TRASAR is measuring the chemistry in the water and making real-time adjustments," Doyle says. The goals are to reduce the amount of water used, to prevent microbes from building up in the water, and to reduce or eliminate scale and corrosion that may impact expensive equipment.
"Even before this whole IoT became big, we had our 3D TRASAR controllers and tanks reporting to us," recalls Bhavik Shah, application development manager at Ecolab. "We used to get around 1.2 million files per day. That's a lot of data."
Craig Senese, director of Analytics and Development, points out that Ecolab had the foresight to start capturing this data in digital form starting in the early 2000s, well before the IoT and big data analytics had taken hold.
"What's interesting about it is that 15 years ago there was the foresight to know that we want to capture that data to the web," Senese says. "3D TRASAR units are not only controlling cooling towers, they are also sending data on the boilers that we service.. So not only are they doing the onsite control of the chemistry in the water systems, they're providing back all of the data that they see in real time. We have this long history of data that we're just now getting into and extracting value from to help our customers. 3D TRASAR has been a great segue for us into the digital world before we even knew that's where we were headed."
Analytics Without Cloud
Ecolab's project teams are distributed among the US and India. A small army of 120 chemical engineers, based in Pune, India, monitors sensor feeds in real time. Then there are some 60 development professionals divided into project teams. The teams use Agile development techniques and Scrum frameworks to keep projects moving.
"Most of our teams include architects, developers, testers, and a Scrum master," Shah says. "Before we moved to the cloud, all of our development was done in-house. All our servers were located in Naperville."
"We maintain our own data centers. It was fairly fragmented," recalls Senese. "We have about 60 development professionals located worldwide and, quite honestly, it was difficult for them to work together in a collaborative environment."
Shah describes the environment this way: "We use Microsoft technologies, so we had Windows Server, SQL Server, and for our applications we used to use ASP.NET MVC, SharePoint, Silverlight, and for data storage, we used to use SQL Server 2008."
Chemical engineers at Ecolab monitor sites around the world.
When data came in from 3D TRASAR units, he adds, the team used BizTalk Server to parse the files and add them to the database. "One of the issues in that was, that we were storing it all in one giant SQL table," he says. That single table proved to be a significant bottleneck.
"We had a lot of applications going into it and trying to read it. There were different use cases for different applications. For example, we wanted to show a chart reflecting year-over-year. That was really slow, because we had to read all the data for multiple years from one SQL table. On top of that, it was really hard for our storage system. We used to expand our storage so fast that we would never be able to predict [requirements] in the future."
Senese agrees that the need for scale proved challenging when these analytics workloads were hosted on-site. "When we want to scale, there's a lot of cost -- there's a lot timeline associated with it," he says.
Ultimately, the need for scale and for speed spurred Ecolab to adopt Microsoft Cloud Services. The results have exceeded expectations.
Advanced Analytics in Azure
"With the Microsoft Cloud, we can scale almost infinitely, both in space and in compute power," Senese says. "We have a global footprint, so when we develop prototypes and we develop proofs-of-concept, shortly following that we have to scale very quickly to a lot of customers and a lot of different regions of the world. What Microsoft Azure brings is the ability to scale very quickly, and it also brings something we haven't had in the past -- the horsepower to do the compute."
"With unlimited capacity and the advanced analytics capabilities, we're able to do much more in real time with the data that we're collecting," Doyle explains. "It also allows us to collect even more data than we were able to before, combining our data with external data, shared information with our customers, or new IOT devices."
"Even before moving to the cloud, we were using Microsoft technologies," Shah says, so moving to Azure was really a good fit for us."
An Ecolab expert diagrams the flow of data from sensors to the cloud to Power BI dashboards.
Having a good sense of the existing workload and desired outcomes also helped with the transition. "We knew what our pain points were. We set our goals, determining what we want from Azure. Then we engaged with Microsoft initially to do a proof of concept. We looked at that proof of concept and made sure that our goals would be achieved with Azure. From there on, we started building solutions on it."
In the initial stages, Shah adds, Ecolab built out capabilities in Azure alongside its on-premises solution, replicating its SQL database so as not to interrupt service. "We had all our data storage in Azure as well as on-premises. That gave us the flexibility to move our current applications to Azure, as well as build new solutions in Azure.
"We wanted to have the current applications still get the data from [on-premises systems], but then make sure that we have a path to move to Azure. So all the data coming to our data center over a year, we rerouted -- after processing in our data center -- to Azure." With applications running in parallel, Shah and his team gradually directed analytics workloads to consume data stored in Azure, especially as new requests came in from business users and customers.
"There was duplicate data out there," Shah admits, "but that did help us in making sure the current applications can still work fine while moving to Azure."
As the transition continued, Shah and his team discovered that the 'old way' of doing things didn't stand up in the cloud. "From the storage standpoint, it was completely SQL on-premises. In Azure, we started using table storage, DocumentDB, data lakes, Blob storage - to make sure that the usage fits the way we are storing it."
The ability to incorporate more diverse data streams also posed a challenge for Ecolab, but one with which they were already familiar. "We had a lot of data formats, as our 3D TRASAR controller had evolved a lot -- we had three versions of it already," Shah says. "Every time a new version came out, we had to write a new BizTalk process. One of the things we did in Azure was, we created WebJobs, which we call 'cookers.' [The cooker] gets the raw data for us and then puts it into a format that's the same across all the platforms. That gave us the ability to do analytics on top of it. We also use Azure services like IoT Hub, Event Hub, and Service Bus, to ingress all the data."
With the cooker in place, Shah and his team were able to connect sensor feeds directly to Azure's data stores. "The sensors, through a gateway, send the data directly to Azure and the IoT Hub. From there on, we went to the same data flow [process] we had for our previous controller, and eventually it went to the same storage."
Next-Level Services for Visualization and Prediction
Having the data in Microsoft Azure enables Ecolab to create interactive dashboards and reports with ease and to share those consoles across mobile devices. "For visualization, we embedded Power BI into our application," Shah says. "We have [also] created a couple of Xamarin apps for iOS, Android, and UWP. They are completely done in Azure. So we have an API hosted on Azure, the apps talking to those APIs, and the storage is in DocumentDB."
The reports enable customers and Ecolab experts to look at water usage at a plant level, at a customer level, or at an enterprise level. Drilling down into the data, Shah says, helps Ecolab pinpoint areas where water usage may be scaled back, for example.
Dashboards built in Power BI help customers visualize and drill down into data.
Being able to aggregate historical data together with real-time feeds, and then to correlate with external data sources like weather reports, for example, leads Ecolab down the path to the ultimate analytics goal: the ability to predict problems before they happen.
"Historically, we focus primarily on reactive-type scenarios," Senese says. "We want to get much more predictive, and the way to do that is to use data and build the predictive models around it. We have the data to do that now. We just need to go out, build the models, use the data that we have, and use the expertise that we have internally."
Doyle agrees. "One project in particular we're working on now is predictive analytics around pathogens in the water stream, to really provide safe water for people around the world. Using [3D TRASAR] data and information like humidity or temperature and other external sources of data, combined with customer programs around treatment of their facilities, we can determine whether something like a pathogen is going to create a problem. Then we can make sure you have the right programs in place to treat them, so you're compliant with the water safety programs that we've put in place and [your systems] are performing optimally."
Although predictive algorithms like these require significant training and effort, Doyle says, cloud services ensure that they can be tweaked and analyzed quickly. "Certainly, when you're talking about something like pathogens in water and protection of people from getting sick, you want to make sure that you're as accurate as possible," he says. "That's the beauty of the cloud; we can connect in more data and figure out what can help with boosting accuracy."
"I feel that's where there will be a lot of growth," Shah says, looking to the future. "We should be able to analyze all this data, go back to business, and tell what we can do with all this data."
He cites Ecolab's system of alarms that alert customers to chemical imbalances or wasted water. "Once the alarm is triggered, the chemical engineers analyze the system and try to figure out what could be going wrong. What we want to do is, if we see some trends going up or down with other data sets, we want to alarm them even sooner.
"These things are really going to be critical to our business; because if we can predict them up-front, that helps us in giving good feedback to the customer, and I think then we both win."
Conclusion
Based on the insights of Ecolab's IT staff, it's clear that cloud computing provides the optimal platform for IoT and big data analytics. Companies that want to leverage this important technology would do well to heed Doyle's advice: "Be aggressive with the technology. Be aggressive with the move to the cloud. Get the scale and the agility and the advanced analytical capabilities that come along with it."
To learn more about Microsoft Azure Cloud Services and hear directly from the professionals at Ecolab, please visit www.zdnet.com/feature/microsoft-advanced-analytics.