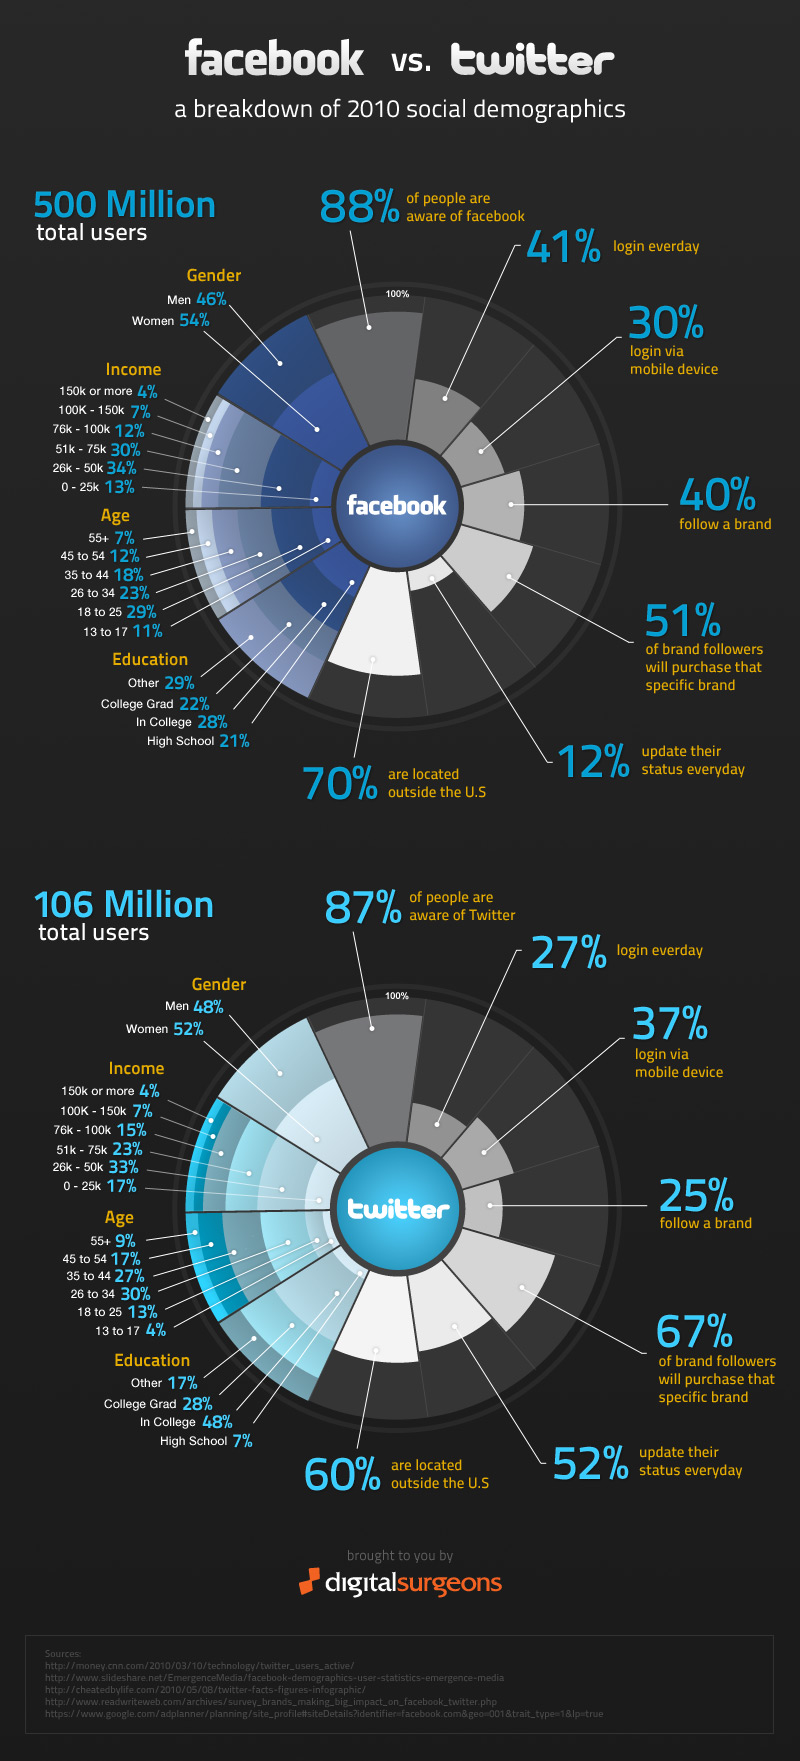
Facebook vs. Twitter: A closer look at the numbers for 2010 [infographic]

Here's a nice granular breakdown comparison of Facebook vs. Twitter demographics put together by Digital Surgeons. There are lots of interesting little nuggets in here. It's no surprise that a higher percentage of Twitter users 'update their status' every day than Facebook, being that updating your status is the only way to actually use Twitter. For all you businesses out there, pay attention to the fact that 40% of all people on Facebook follow a brand, and 51% of those people will actually purchase a product or service from a specific brand. My speculation is that these numbers will go up at least 50% by end of next year as companies get smarter and continue to re-prioritize how and why they do business.
Some of the fonts in this chart can be a little small for our blog layout so if you are having trouble reading some of the smaller print, the larger size original gangster version of this infographic is located here.
