If you can't talk to your colleagues, this is the design language for you

Like many other diagramming systems, it uses symbols and connectors to help people plan and illustrate how services should work and how customers will interact with them - and it's named, aptly, Visual.
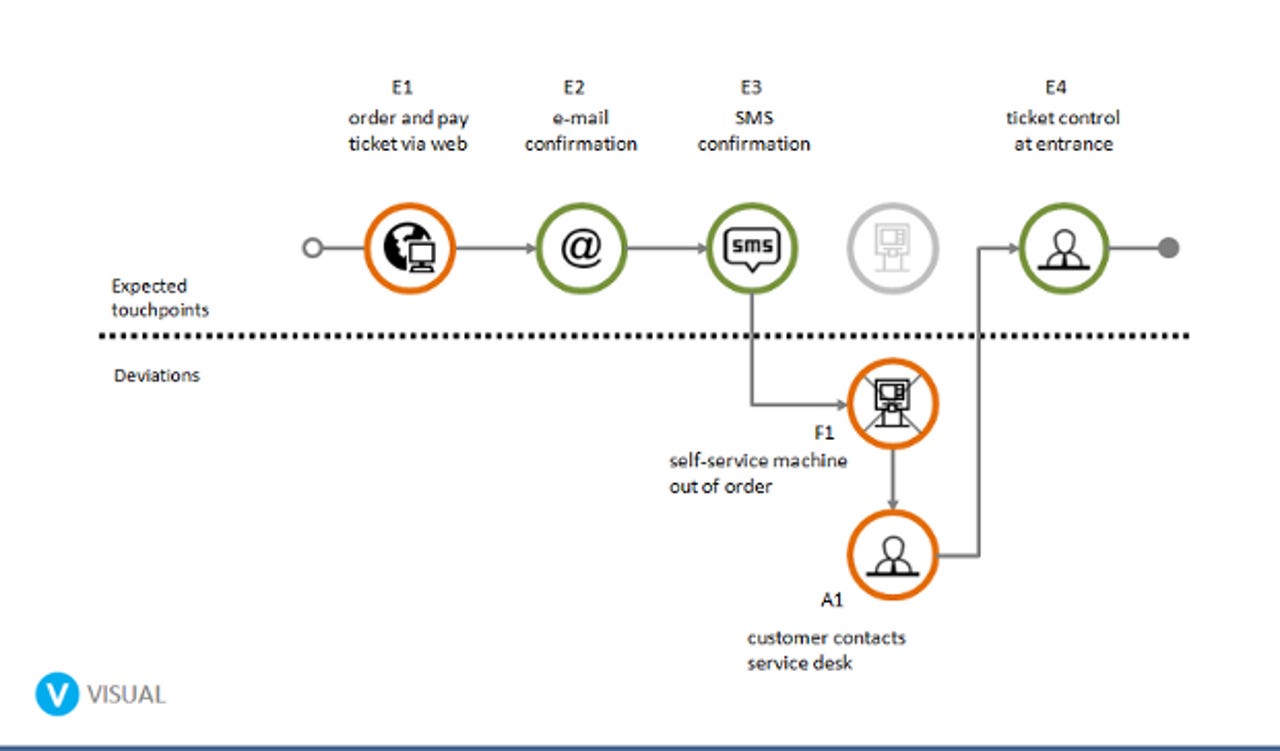
Visual is designed to let businesses document their "customer journey," or how their users progress through using a service. It logs each contact users have with a service, such as receiving an email or SMS confirmation, and records the points at which the customer is handed over to a different part of the service or new unit in the company.
Visual aims to help make communication smoother between all staff and departments involved in providing the service, while at the same time never losing track of the users' point of view.
Bridging the gap
One of the problems the project has identified is the communication difficulties between the various stakeholders in a service, where different departments or job titles use different terminology, causing difficulties when service descriptions and specifications are handed off from one to the other.
As a result, staff may find it hard to convey precisely what the service is supposed to do, let alone how it should work.
"In different organizations, there are different perceptions of what products are, and what services are. It's hard to define what services are, and there is no universal definition. Accordingly, there are lots of 'tribe languages' out there, which applies to specific services, but they aren't universal," Ragnhild Halvorsrud, senior researcher at SINTEF and project leader for Visual, told ZDNet.
"As most of us have experienced, many services don't work too well; they haven't got a good flow. We believe that the reason for that is that there aren't any easy tools for visualizing what we call the 'customer journey'. This is the customers' total perspective of using a service," Halvorsrud said.
Alternatives?
While IT departments have used tools similar to Visual for some time, many of them have been purely for developers, and were used as a step in developing the algorithms before they're translated into programming language syntax.
The classic flow charts may be the oldest example of such tools, but most don't make a great deal of sense for people outside of the programming profession. The same can also be said for other newer process description tools. But Visual aims to be easy to use for a wide variety of roles within a company.
"What sets Visual apart from other types of diagramming tools, like for instance BPMN which is a widespread standard, is that these flow diagrams quickly get too complicated.
"When flow diagrams get too technical and complex, you'll lose some of the people who need to understand the service. But most importantly, you'll lose the customer from view; the service user is disappearing," Halvorsrud said.
"There's also a service design flow diagram system that's called 'service blueprint', which is a flow diagram notation that tries to describe what's happening with the customer, and holds that apart from what's happening internally in the IT systems. But that system can't cover the complexities about everything that relates to the user. It gives a very static picture, it just shows the principles of the user interaction - it doesn't show the dynamic picture," she added.
Documenting exceptions
Another important difference between these well-known service description schemes and Visual is that Visual is designed for documenting what happens in typical customer journeys, as well as the exceptions.
"The big difference is that Visual is able to show the differences between what's planned, and expected user experiences, and what's actually happening in real-world customer interactions," Halvorsrud said.
Because of this, the project quite quickly realized that Visual is just as suited to documenting and analysing existing services, as to developing new ones.
Halvorsrud said many new services reuse components from existing products and services. She added that these days a service is hardly ever finished when the first version is in production - many services enter a cycle of repeating analysis and improvement for the entire lifespan of the service.
"It's just as important to analyse existing services," Halvorsrud said.
Focusing on the user
"The idea for Visual is based on lots of experiences collected both from research and in cooperation with industries. We saw it was difficult for employees, in particular in larger organizations, to get a holistic, common and agreed upon understanding of customer experiences. We need to find a common language to get an identical description of how the end user perceives the service," Halvorsrudat added.
SINTEF is Scandinavia's largest independent research organisation, and Halvorsrud is a researcher in the Human Computer Interaction group at SINTEF's ICT department. The Visual project is a co-operation between SINTEF, Linköping University in Sweden, and four Norwegian businesses from different industries.Visual was born out of the understanding that many, if not most, services aren't good enough, according to the customers that use them.
"There's a well-known problem often termed the '80/eight-paradox', which was coined by management consulting company Bain & Company. It's about the delivery gap many businesses struggle with. Eighty percent of business managers believe that their company delivers fantastic services, but only eight percent of their customers agree. Accordingly, we saw a great need to find a new way of expressing things that makes it easier to see the service from the customers' perspective," Halvorsrud said.
The end is in sight
Visual is still a work in progress, currently on version 2.1. The project has planned a couple of case studies and expects to release a version 3.0 before the end of this year.
The Visual project has already published the current version of its graphic elements in several different formats on the project web page, which are publicly available for download and testing. Through this openness the project has already gained some attention, not only in Norway, but in neighbouring countries as well.
"We got a lot of inquires after a seminar we hosted this winter. They were everything from academic institutions in Sweden to private companies here in Norway. They want to test it and try it out, and this has been a conscious strategy on our part, to publish what we've got now, even though the project isn't finished yet.
"We are more than half way now, but we feel we already have got something that could be useful for others already. The reactions have first and foremost come from from Norway, but we also had some inquiries from Sweden and the UK," Halvorsrud said.
Read more on this story