Smartsheet steps up visualization game

Smartsheet, a collaborative work management software as a service vendor, on Monday added features that can allow companies better visualize processes, workflow and how employees are collaborating.
The company, based in Bellevue, Washington, counts Extreme Networks, Groupon, Cisco, Netflix and a bevy of other enterprises as customers, has been a popular add on service to integrate with tools such as Salesforce and Box. Smartsheet offers Gantt chart features and project management in a spreadsheet interface.
Smartsheet's visualization tools provide a dashboard that shows workflow within companies across multiple functions such as marketing, operations, manufacturing and human resources. Smartsheet's tools are sticky in enterprises because users start sharing sheets as a collaboration tools.
Adding visualization tools to enterprise software has been a trend in recent years. The Holy Grail is to give every worker access to enterprise metrics at a glance so they can act on them. Salesforce recent analytics cloud was one part data integration, but the real win may be the user experience. Other companies such as Tableau are gaining traction largely because the interface is easier to use than traditional business intelligence.
At some point, enterprise software vendors will nail visualization, but for now upstarts such as Smartsheet stick out.
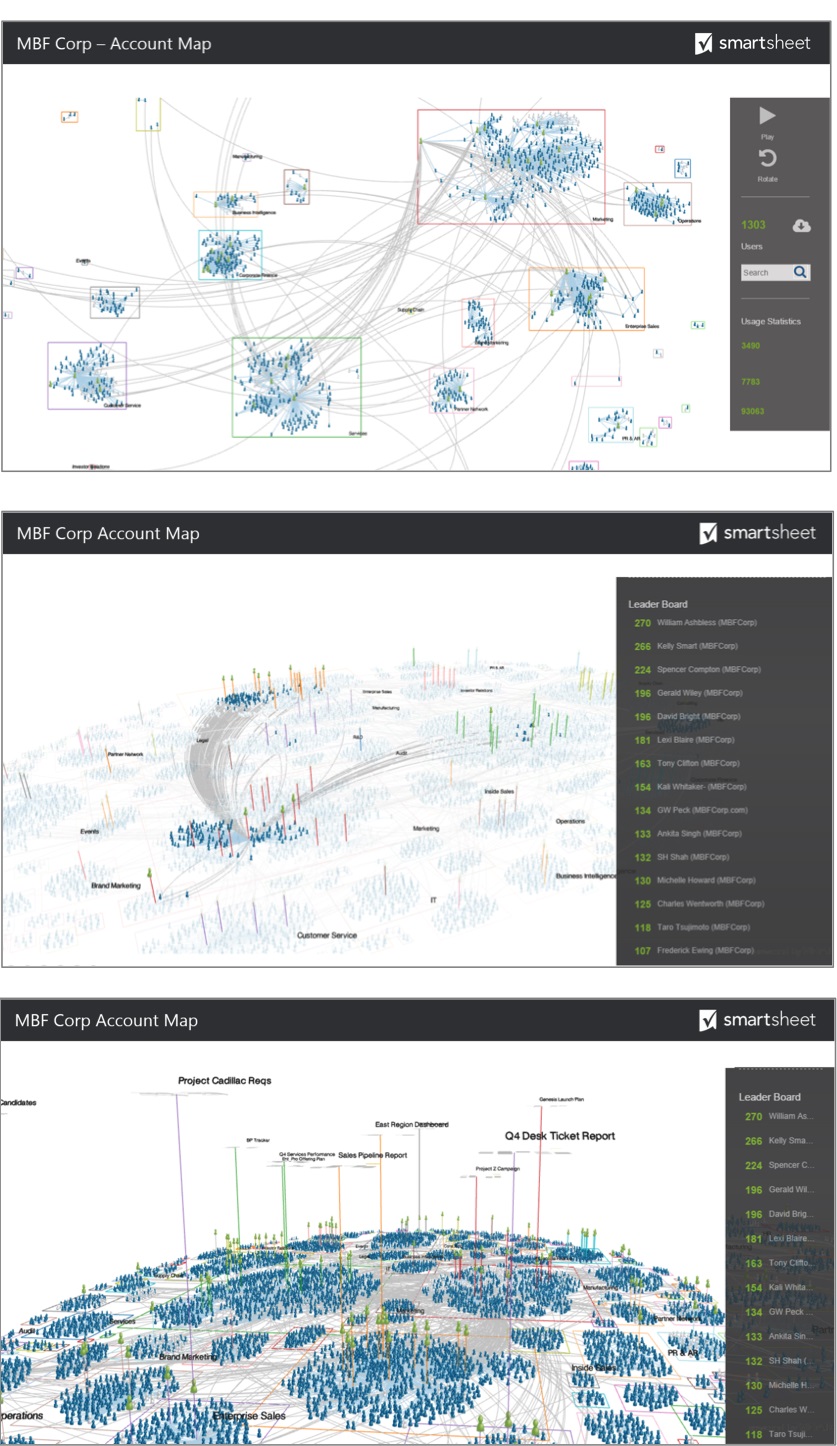
Smartsheet's enhanced visualization tools provide everything from account level views to the big picture across a corporation. Smartsheet's visualization tools are based on an algorithm that analyzes how work is conducted and identifies groups of employees and partners that touch a project.
Here's a look at the visualization capabilities.