Students create NCAA March Madness predictive analysis via Google Cloud

Last year, as it began a formal relationship with the NCAA as its official cloud provider, Google Cloud showcased its data analytics and machine learning tools with live predictive TV ads during the NCAA tournament, as well as game and data analysis. This year, it's taking the campaign a step further -- Google has recruited around 30 college students to deliver the March Madness analysis. The student-led analysis is intended to illustrate the accessible nature of Google's analytics and machine learning tools.
Cloud
At g.co/marchmadness, you'll be able to check out information as the tournament is happening, including descriptive and predictive analysis. Real-time dashboards -- surfaced via Data Studio, Google's free dashboarding and visualization tool -- will provide analysis of concepts like "score control."
"Score control" quantifies how teams manage the score over a game. That includes how well a team plays once they take the lead, when they're in a deficit and how much time they're controlling the game.
"That kind of information doesn't exist in box scores," Google Cloud advocate Eric Schmidt said to ZDNet.
From there, you can also access training that will teach you how to develop workflows to produce similar insights, or to apply Google's tools to your own use cases such as demand forecasting or sales analysis.
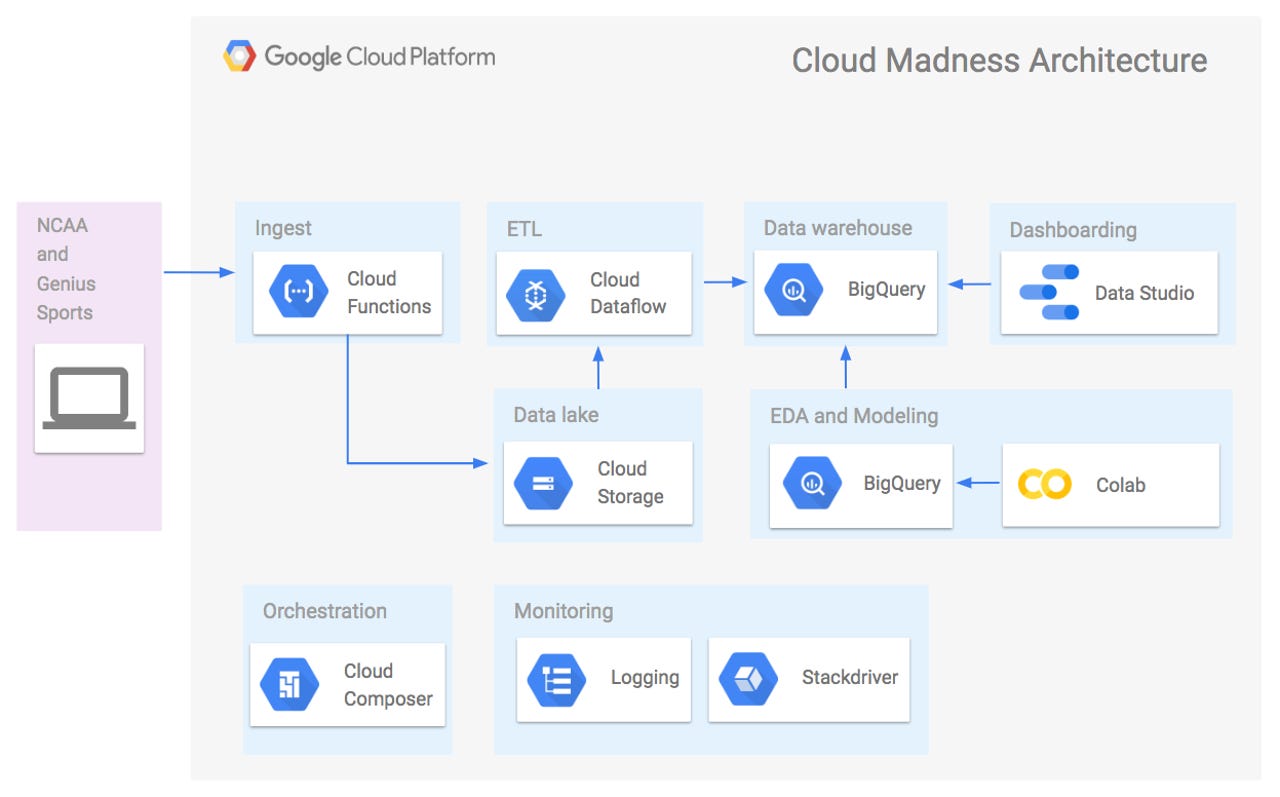
Like last year, the March Madness analysis was built in a serverless, managed environment using tools like Google Cloud Dataflow and BigQuery. This year, it also leveraged Cloud Composer, Cloud Scheduler and Cloud Functions. For exploratory data analysis, students used two Google Cloud optimized data science environments: Colab and Deep Learning VM images. They mainly used BigQuery ML to train, evaluate, and serve predictive models.
To prepare for the tournament, Google back in January partnered with MIT to host a hackathon for students from across the US. The students explored the analytics environment Google built for the NCAA, and at the end of the day, there were 17 projects presented. From there, Google chose about 30 students to build metrics for evaluating college basketball teams. The students were directed to create metrics for typically qualitative factors like a team's "explosiveness." To measure "explosiveness," they explored data around variables like dunks and scoring runs.
While the students worked alongside Google Cloud mentors, Schmidt said the hackathon was intentionally designed to mirror the experience Google enterprise customers may have as they consider how to leverage their data.
"We intentionally did not prime or coach [the students] up front on how to use the tools," he said. "We presented them with a formulation -- go explore an idea around 'explosiveness' -- and gave them high-level guidance on where this data lives inside of these tools and let them go on the journey of how pieces of information fit together, how could you query them."
Depending on their skill sets -- whether that included SQL, Python or R, for instance -- students could approach the data differently.
"With enterprise customers... we assume you're going to bring the existing knowledge you have around your domain," Schmidt said. "The initial user experience around cloud should be one that's very natural."