PacketTrap gives enterprise 'Perspective'

You can use any notifications you wish, and by using a public SMTP server or your own enterprise's SMTP, this'll ensure it won't be marked as spam.
As you can see, within seconds of sending a test message, it'll appear in your inbox.
Either way, it's easy to get started with all the help it gives you.
From here, you'll be able to select the different devices and servers you want. Often there are many network administrators, maybe taking a chunk of IP's at a time or specialists working on servers or routers alone. This makes it ideal to allow those who need to look at certain things to do their job without extra "faff".
From here, you're given the option to create your own policies, or allow Perspective to create its own, depending on what type of hardware, software and server you are running.
This makes it easy to customise your network perspective and allows you to pick and choose what you want to monitor.
You can set it to alert the administrator or anyone else in the organisation. You could even set multiple triggers - if disk usage gets too high and network usage is too low, something is obviously screwy and needs looking at.
Similar to the other screen, but allows you to create a policy for servers alone.
Not only that, it'll guide you through it and tell you if another server is covered by a different policy. Naturally, some servers control networking (DHCP or DNS) so they may want to come under remit of both policies.
Perspective doesn't allow you to just reset an adapter, so for automating purposes, restarting the server should fix this. If conditions are met, it'll restart the computer and using logic, it'll reset the alert once the network adapter is "NOT" down. Clever stuff really.
A quick look at the server in Reports will tell you the problem, and whether it's something that can wait until the morning or whether you have to grab your clothes and run to the office!
Not only does it tell you problems, with a bit of thought process, it can help increase the stability of your network by planning future infrastructure.
Of course, if a server in Brussels needs some work, it's better to see it there than get to the Canterbury server room and realise it's still about 2,000 miles east of you.
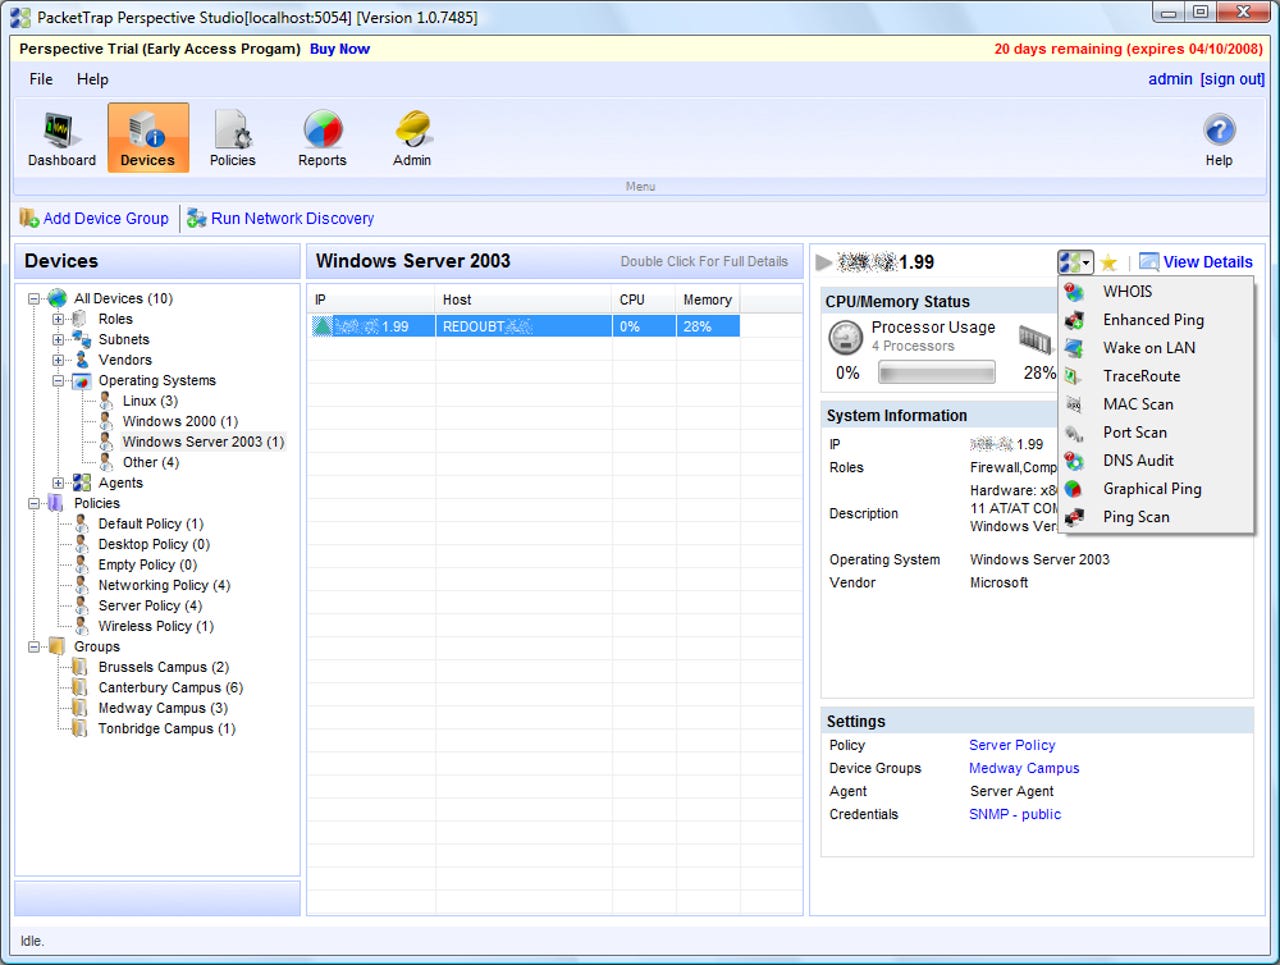
From the Devices menu, you can apply different tools to your servers and devices to see how well they are doing, but also check basic diagnostics. It also boasts some pretty impressive statistics and information about that server.
This screen will show you the essentials of your server or device's health; includes a response and availability chart, roles of that device, operating system, vendor, any alerts it may have encountered and plenty of other stuff.
Each server will have a software inventory - essentially an "Add/Remove" programs except in remote viewing. Makes life easier when diagnosing software related issues.
Considering that Windows services can sometimes stop for no reason, if a server isn't responding to a DNS call, by checking to see if the DNS service is running on that machine is made easy now. No more do you need to remote desktop in and check - it's all there with a few clicks of a button.
In the Reports pane, you have access to a whole load of logs. You can see which servers are doing well, and which aren't, by a whole load of different customisable options.
(c) PacketTrap 2008; used with permission.
(c) PacketTrap 2008; used with permission.
(c) PacketTrap 2008; used with permission.