EclipseCon Day 1: Tutorial: The Eclipse Debug Framework

I had a hard time finding my first tutorial this morning, since I walked over to the convention center first only to find it wasn't there. The convention center is connected to the Hyatt so you don't have to endure those freezing California temperatures but the signs were confusing. Eventually, thanks to a couple of helpful convention workers, I joined about 15 other people in the right location.
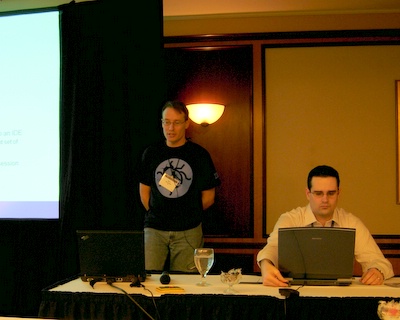
Darin Wright (standing) and Michael Rennie started the tutorial with an introduction to the debugging framework. The framework is split into two parts: core and UI. The core consists of launch configuration types, launch configurations, launch managers, launch delegates, and launch objects. The UI is made up of tab groups, and launch shortcuts.
A question from the audience was how to send signals to a launched process. Unfortunately there is no standard Java API to send a signal or even get the process ID of a System.Process. An enhancement request has been pending for years (since Java 1.2) to add this.
Launch shortcuts are responsible for the "Run As>" and "Debug As>" context menus when you right click on (for example) a Java class or Ant script. Your code can decide what to do when the user selects it (for example reuse an existing launch configuration).
Debug Model
Next, they covered the Debug Model. The debug model is the intermediary between Eclipse and the target program being debugged. It consists of the core (debug model elements, capabilities, and debug events) and the UI (views, actions, and debug model presentation).
The standard debug model contains a debug target, threads, stack frames, variables, and register groups. Variables can contain values, that can contain other variables for complex types.
The standard debug capabilities include step, terminate, disconnect, and drop to frame. The debug toolbar buttons operate against these interfaces. Events describe whatever's happening in the program being debugged. It contain a type and detail code. For example, Create, Suspend, Resume, and Terminate.
Debug UI
Debug views work against the standard model and update in response to debug events. These include Debug, Variables, Registers, Expressions, Breakpoints, Console. Debug actions act on the debug model elements. For example the step action works on instances of IStep, etc.. This has become more flexible in 3.2. All the actions have become retargettable and there are adapters that allow you to work against arbitrary implementations. Debug model presentation provides standard images and text for things like resume and watch.
So what happens during a step-over operation? For this example the presenters used a machine language interpreter written in Perl. Keep in mind everything is multithreaded, and debuggers can be unreliably (due to latency, etc.). So the UI has to be careful and not to block. To begin, somebody presses the step button, which sends a step command to the debug target which returns immediately. Then it forwards the command to (in this example) the interpreter). Later, the interpreter sends a resume event which is passed back to any listeners. Thus the whole operation is completely asynchronous.
Into the platform they built support that if a step doesn't finish with 500ms, then the frames will be collapsed. This prevents excessive expanding and collapsing and improves the user experience.
Breakpoints
Most debuggers have breakpoints, such as line breakpoints, watchpoints (triggered when you modify a variable), run-to-line, and exception breakpoints. The framework Eclipse provides includes the ability to register breakpoints, change notification, persistent breakpoints across workbench invocations, and retargetable actions to create breakpoints.
The types of breakpoints your debugger provides is completely dependent upon the architecture you're supporting. Things that aren't supported can often be simulated. For example, hit points, and conditional breakpoints.
The breakpoint core includes a breakpoint extension, breakpoint model object, marker, breakpoint manager, and of course the debug target. The breakpoint UI includes retargettable actions, editor support (displays markers), ruler double clicking, and the breakpoint properties dialog. All breakpoint attributes are stored in a marker, providing persistence for free.
JDT breakpoints provide a good example of how breakpoints should work. For example you can set a breakpoint before the program is running, or before a class is loaded, and the debugger will wait until it's possible to set the breakpoint. The same technique could be used for setting breakpoints in dynamically loaded native code, for example.
The breakpoint manager is a repository of all breakpoints in the workspace. It provides change notifications as breakpoints are added, removed, or modified. It also supports quickly disabling all breakpoints (for example when evaluating intrinsic expressions like toString()).
Retargettable actions support a common set of breakpoint sets. The main reason they're used is to avoid polluting menus with similarly named actions (Break line Java, Break line C, Break like Ant, etc.). Instead, there's just one "Break line" action whose meaning is changed depending on what you're debugging.
Source lookup
The source lookup framework was added to the debug framework in version 3.0. Each launch object has a source locator associated with it that's responsible for locating the source for a specific stack frame. On the UI side, the debug model presentation maps from the source element to a corresponding editor.
The basic interaction is you suspend somewhere and a stack frame is selected. The source locator finds a source element for a stack frame. The debug model presentation maps the source element to an editor input and editor id.
The implementation of a source locator consists of a director (holds the path list), participants (maps stack frames to filenames) and containers (find files by filename). Filenames are simple text strings but the format can be anything you want.
To use the lookup framework, create the initial set of participants and the initial set of containers. The path list can be overridden. Source files can be external to the workspace, but markers can't be displayed on external files (because they are not "resources").
How do you get your source locator created at launch time? The launch delete can instantiate one, but another way is an extension point called sourceLocator. Doing this, the framework will automatically instantiate the locator for you. The platform provides implementations of standard source containers, such as workspace folders, projects, and archives, plus local file system directories and archives.
The container idea is somewhat orthogonal to the new Eclipse File System. Darin said they should work together, for resources defined through EFS.
Variable Customizations
The Variables view has some special features in it that you can take advantage of. You can emphasize variables that change value, display logical structures, details, code assist, and editing of variable values.
To emphasize variable value changes, there's a method on the variable (hasValueChanged()) to tell whether or not the variable has changed. This must be done efficiently because it's going to be called a lot. The JDT debugger uses a timestamp.
Logical structures provides alternate presentations for your variables and values. For example, you can show a Vector as an Array (instead of all the private variables inside the Vector class). You can define multiple logical structures, selectable by the user. Right click on a variable, and select Show As to see all the logical alternatives.
The details area uses text provided a debug module presentation (asynchronously). The presentation can specify a SourceViewerConfiguration that includes content assist.Variable editing is supported by IValueModification or through an extension point called variableValueEditor.
Custom Views and Actions
The debug platform provides a single perspective with the commonly used views. But you may want unique views to leverage features in your debugger, such as custom actions, new views, and capabilities. The ability to do this is actually provided by the Workbench, not the debug framework.
Developers are encouraged to re-use the debug perspective in order to provide a common look and feel for all debuggers. But in order to avoid pollution of the perspective, many techniques are used including object contributions and workbench capabilities.
Custom views should be placed in the org.eclipse.debug.ui category so they'll be grouped with other debugging views and thus more discoverable by the user. Views can be automatically opened and closed based on context. For example you could have your memory window close when the program terminates. Doing this in the face of user actions is tricky, for example if the user opened or closed a view manually, by default the framework won't automatically do anything with that view again, figuring that the user will handle that.
That wraps up the morning session of the Debug Framework tutorial. An evening session was scheduled to cover more advanced topics such as non-standard debug models, but I decided to attend a presentation on the Eclipse Forms UI instead.