First Take: Tableau 6.1

It's been a while since we looked at Tableau, a tool for desktop data analysis. Aiming to democratise data, Tableau doesn't need to work with data warehouses or online analytics tools — instead, it lets you work with raw data, building graphical mashups of information from local spreadsheets, remote SQL queries and databases, and even from public data downloaded from cloud sources. Where you might have used Excel to explore pivot charts and reports, Tableau lets you ask questions and find your own answers, with tools that let you drill down into the results and uncover the insights that help you make the right business decision at the right time.
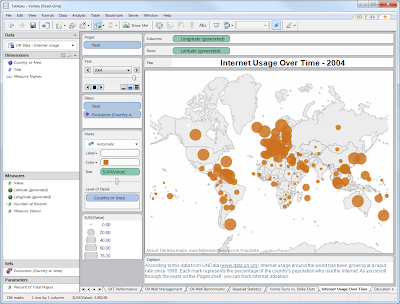 Tableau's report design tools let you plot data on maps as well as on traditional graphs
Version 6.1 of Tableau has many improvements. It's now a lot easier to work with data that updates regularly, with support for incremental updates. Although the process works with any unique identifier, it's easiest to work with dates and times, and it's possible to schedule updates if you're working with regularly changing data. Tableau will identify new data and bring it in, without creating a new extract, speeding up the process considerably. You can also add data from different files, so you don't have to wait for the latest data to be processed centrally before you can use it. Tableau also improves its support for information security, so you can use it in conjunction with existing database usage and security policies, locking data down by user, role or group. A new text file parser now lets you work with any size file, making it a lot easier to work with large files full of raw data — so you can now quickly analyse large log files, making Tableau useful for web analytics and as a way of visualising security information.
 Use Tableau with pretty much any data source going — including OData feeds
One of Tableau's key features is the ability to geocode data and plot it on maps. The latest version adds support for postcodes in many more countries across Europe. If you're using Tableau with UK postcodes it will now work with just the first part of a postcode, letting you map data onto a larger, more anonymous, area, as well as supporting non-geographic special postcodes. There's also a new map style that makes it easier to see data, giving your map views more contrast — and at the same time improving their design. Maps are also touch aware, so you can use touchscreens and multitouch trackpads to manipulate views. It's all very well getting data, processing it and publishing it, but it has to look good. That's still Tableau's main strength, as it makes it easy to quickly visualise complex data. New layout tools make it easier to arrange chart legends, making them more design friendly and much less Excel-like.
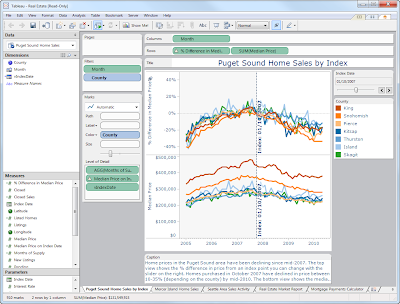 Use Tableau to plot and analyse data on the fly
Perhaps the biggest change is the arrival of a mobile version. Reports built using Tableau's server product can be delivered to iPads and other tablets as interactive documents, with no need to create special views for mobile as opposed to desktop. Server views support touch controls, and a native app gives you tools for filtering reports and searching — while ensuring a secure connection to the server.
The latest Tableau release is focused on making it easier to work with large data sets, a feature that's increasingly important as more and more information floods our businesses — information that needs to be analysed in a timely fashion. Where Tableau really succeeds is in democratising data. Its new features make it easier to use it to analyse ad hoc data sources, or to get a quick picture of trends before data is fully processed. Getting to answers quickly is increasingly important, and Tableau will help give you a head start.
Simon Bisson