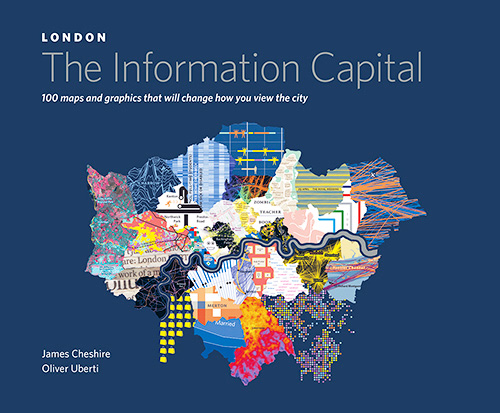
London: The Information Capital, book review: Data visualisation done right

Modern information mappers like geographer James Cheshire and ex-National Geographic designer Oliver Uberti have the advantage of a huge volume of information about the city. You can get the times and locations of tweets and Flickr images and other publicly shared data for any place with enough people to make it interesting, and while the very first data point in the OpenStreetMap project was in Regent's Park, it now covers much of the world. But the various government open data initiatives that cover London have given the authors what they call "an unprecedented amount" of information from which to draw their maps.
London: The Information Capital is a beautifully produced book that's cleverly put together: translucent overlays let you compare the size of modern London with the Roman settlement and city wall, or see how distribution of income has changed since Booth's influential 19th century poverty map. The authors don't try to tie all the information into a single story, but the very diversity gives you a comprehensive view of a diverse place, and the variety of design styles employed keeps everything interesting.
Individual statistics -- like the 2,580 mobile phones and 2,380 pairs of glasses left at Heathrow Airport in 2013 or the six Shard-heights of free Metro newspapers handed out in London every day -- can be intriguing, while seeing the cycling history of the top 25 users of the rent-by-the-hour 'Boris bikes' may raise some questions about privacy in the age of tracking. But it's the breadth of information -- from commuting habits and the huge changes in the population of the city by day and night, to where people tweet and take photos by day and night, to how data flows across London, to how the Urban Heat Island Effect turns London into a hothouse in summer, to how the population of London plummeted after the Second World War and won't reach 1939 levels again until 2021 -- that gives you a picture of the whole city.
Some maps, like the classifications from the census, have so much information you can hardly read them -- an example of how difficult it is to show the diversity of the London population. Clustering those into groups from high-rise high density to the ageing city fringe makes for a map that's easier to understand. The map of a week's worth of tube journeys, coloured by density, looks more like art; the GPS tracks of minicabs look rather like brain activity; the density of bus journeys paints a simplified map of London's roads. And yes, the passenger levels on the unpopular Emirates Air-Line show it really is a cable car to nowhere. Londoners are often in motion -- the map of where people tweet from highlights the tube and bus routes across the city.
Redrawing the London borough map to show levels of obese children looks suitably disturbing; clouds of smoke show how Londoners aren't doing well at giving up smoking. And if you look at the map of crime (shoplifting and theft in the centre, stolen cars further out and break-ins in the suburbs), be sure to compare it to the charts showing that crime rates are falling (as are road accidents) while the fear of crime is rising -- and also to what all the police helicopters are looking for when they fly over at night. Some pages are more whimsical -- the animals in London Zoo, which artists have most pictures in the Tate (Turner has nearly 40,000 works), which other cities have their own version of the London Eye.
This is a gorgeous atlas of a modern city, with data and visualisation that does what most infographics only aspire to: it takes a vast amount of information and makes it clear and understandable. No matter how well you know London you'll see something in a different light. And even if you have no interest in the city, you get a picture of our modern digital life in action -- and a fascinating demonstration of the power of data visualisation done right: