Android sales surge, surpass iPhone (Updated)

Two different surveys released this week show the Android platform is gobbling up US and worldwide market share from other smartphone operating systems including Apple's iPhone OS and RIM BlackBerry.

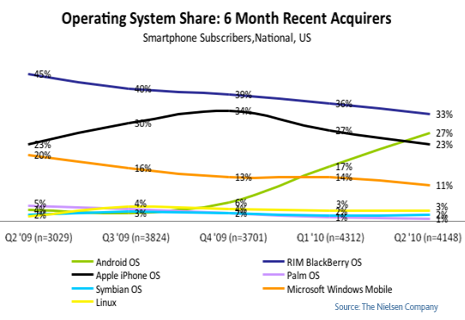
The first survey, from the Nielson Company, shows that new sales of Android-based devices surpassed iPhone sales for the first time in the 2nd quarter. In the US, Android accounted for 27% of new sales, where the Apple iPhone accounted for 23%. RIM continues to lead the way with 33% of the market, according to Nielson.
Keep in mind that these figures do not include sales of the iPod Touch and iPad, which run the same operating system as the iPhone, because they are not phones. Also the 2nd quarter numbers reflect only a portion of sales of Apple's new iPhone 4, which started in late June. Apple is expected to get a boost from that in the 3rd quarter, so these stats could flip flop a couple more times before the end of the year.
Research firm Canalys also released a survey showing that worldwide shipments of Android-based phones in Q2 2010 were over 8 times larger than the same period a year ago. Nokia retained a substantial lead at 38% of the global smartphone market, with RIM at 18%, Android at 17%, and Apple at 13%. Interestingly, Canalys says that in the US, Android has surpassed both RIM's and Apple's market share (34% vs. 32% and 22% respectively). I sent in a question to Canalys to explain the discrepancy. See the update below for more info.
Numbers for new phone sales are important for developers because of the lead times for new apps and games. While a tiny app can be put together in a few days or weeks, substantial titles can take 6 months to a year or more to move from concept to finished product. Developers and publishers are always trying to guess where interest will be in the future so their product can reach the most potential users.
The uptick in Android sales is also backed up by anecdotal evidence of growing interest in the platform that shows no sign of slowing any time soon. Sources in the industry say that app submissions are up, book sales are up, and training classes are becoming more and more in demand.
Update: I asked Canalys to explain the difference between their study and the one by Nielson. Tim Shepherd sent me this response:
There are a number of possible variables that could lead to disparities. I cannot, for example, comment on precisely how Nielsen defines a smart phone, or on how they collect their data and how comprehensive it is. I suspect, however, that the difference in this case primarily stems from the fact that the Nielsen survey appears to refer to subscribers where as the Canalys data refers to shipments of devices into the channel. These numbers are unlikely to tally as there is clearly a variable time lag between different products shipping from the handset vendors, to being sold through to end users and subscriptions being activated and counted.
What I can also say is that Canalys has tracked quarterly smart phone shipments (sales in) since 2001 and are widely acknowledged as the leading analyst firm providing smart phone market data, forecasts and analysis to the global hardware, software and service provider communities. Our methodology involves obtaining feedback from vendors on their shipment volumes and extensively cross checking that information with other sources from the channel, from component suppliers, OS vendors and operators. The numbers we release are Canalys best estimates at the time of publication, but rigorous adherence to our globally consistent methodology allows us to be highly confident in our numbers.
Tim also sent me the following chart which was not included in the Canalys press release:
Worldwide smart phone market
| OS vendor | Q2 2010 shipments | % share | Q2 2009 shipments | % share | Growth |
|---|---|---|---|---|---|
| Symbian | 27,129,340 | 43.5 | 19,178,910 | 50.3 | 41.5 |
| RIM | 11,248,830 | 18.0 | 7,975,950 | 20.9 | 41.0 |
| Android | 10,689,290 | 17.1 | 1,084,240 | 2.8 | 885.9 |
| Apple | 8,411,910 | 13.5 | 5,211,560 | 13.7 | 61.4 |
| Microsoft | 3,083,060 | 4.9 | 3,431,380 | 9.0 | -10.2 |
| Others | 1,851,830 | 3.0 | 1,244,620 | 3.3 | 48.8 |
| Total | 62,414,260 | 100 | 38,126,660 | 100 | 63.3 |