Net Market Share vs. StatCounter: Whose online measurements can you trust?

Measuring the popularity of modern computing platforms is an imperfect science. Nothing makes that point more emphatically than a comparison of the reports from the two top independent data-gathering companies on the web, Net Market Share (also known as Net Applications) and StatCounter.*
On some measures, the two data sources are in near-perfect alignment. On other measures they're wildly far apart. Which one's more accurate? Is it possible they're both right?
I've been looking carefully at these two widely quoted data sources, trying to figure out what makes them tick.
Both companies offer web analytics products that are conceptually similar. By sniffing browser strings and using tracking codes on pages in their respective networks of websites, each firm has assembled a massive store of data about the technology driving those online interactions: country of origin, device type (mobile/desktop/console), operating system, browser, and browser version.
For visits from desktop and portable PCs, the samples are very large for each company. Net Market Share says its reports are based on 40,000 websites worldwide, with 160 million unique visitors per month on desktop and mobile devices. StatCounter’s monthly totals for desktop and notebook PCs consist of 15 billion pageviews recorded at 3 million sites. (That number might sound large, but it’s actually a drop in the bucket, web-wise, given the most recent Netcraft estimate of more than 861 million websites worldwide.)
Net Market Share doesn’t break down its mobile dataset. StatCounter says that in June 2013 its mobile report was based on 2.6 billion pageviews. (Presumably subsequent months have seen similar traffic levels.)
Differences in sample size on a per-country basis have a big influence on usage reports. At StatCounter, for example, more than 26 percent of mobile views are from India, making it the most popular region in its mobile dataset. By contrast, only 7 percent of StatCounter's desktop pageviews come from India. Roughly 21.5 percent of mobile StatCounter's traffic is from the United States; on the desktop, the U.S. share for pageviews is a bit higher, at 24 percent.
Those geographic differences can have a huge influence on more detailed statistical breakdowns. And on mobile devices in particular, different populations have different use cases. In the U.S., a smartphone is likely to be a companion device, with its owner having access to a PC or Mac as well as a tablet. In emerging markets, a mobile device might be an individual's only connection to the online world. So in StatCounter's mobile dataset, with more than a quarter of the traffic drawn from India, it's not surprising that Nokia's Series 40 operating system used on its low-cost Asha line, has a double-digit share according to StatCounter.
Because of these geographic differences and the constantly shifting mix of usage for mobile devices, I'm reluctant to assign too much confidence to either company's mobile reports. The desktop reports, on the other hand, are much more consistent.
Each company has published detailed descriptions of its methodology, which are worth reading:
The crucial difference, as you’ll note if you read the methodologies carefully, is that Net Market Share attempts to measure daily unique users, while StatCounter measures total traffic. If you visit a single page in the Net Market Share network, you’re counted, and then your visits to any other page on any other site in the network are ignored for the rest of the day. Net Market Share weights the data by country, StatCounter doesn’t.
As a result, Net Market Share stats count every user equally, while StatCounter gives extra weight to heavy web users.
Let’s stipulate that the sample sizes for both data sources are sufficiently large, the data collected is accurate, and the populations are reasonably representative of the Internet at large. In that case, any differences you see between the two data sets will represent different behavior (and different choices in hardware and software) on the part of high-volume web users, who are presumably more sophisticated than casual web users. Which measurement is more useful? That depends on why you’re asking the question.
When it comes to the worldwide mix of desktop operating systems, the two companies paint a nearly identical picture of the market:
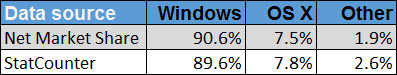
Both sources calculate the base of Windows PCs worldwide as around 90 percent, give or take a half a percent. Both services peg the worldwide usage of Macs running OS X at a bit over 7 percent. The only noteworthy difference in the other category is that StatCounter detects that 1.3 percent of all desktop/portable PCs are running Android. (Not Chrome OS, which both sources measure at an identical 0.1 percent of usage, but Android. I can’t explain that at all.)
Those numbers line up neatly with years of sales history from IDC and Gartner, which helps their overall air of accuracy.
So with that first group of numbers in total agreement, why do the two sources differ so completely when it comes to desktop browsing? See for yourself—the following two charts summarize the share of usage for top browser versions, as measured by the different companies.
If you believe the Net Market Share numbers, Internet Explorer 8 on Windows XP is still the undisputed champ of web browsing. But in the StatCounter world, the latest version of Google Chrome absolutely crushes the competition. What's the difference?
It's possible, even likely, that both of those charts are accurate. As the Net Market Share numbers make clear, most people simply accept the default browser that came with their PC, updating it only if the process is automatic and invisible. Those who use a web browser heavily are more likely to choose a favorite, and that favorite tends to be Chrome.
So, if the question you're asking is "What web browser is the average PC owner most likely to use?" then Net Market Share has the most accurate answer. If, on the other hand, your question is "Which web browsers are you most likely to encounter if you collect a large sample of web traffic?" then StatCounter's numbers are probably going to give you a more meaningful result.
But as I dug into the two datasets, some less obvious conclusions about the state of modern web browsers became apparent. That's a subject for my next post.
* The Wikipedia page that covers Usage share of web browsers includes three other data sources besides Net Market Share and StatCounter:
- Clicky is a web analytics company that measures pageviews in the style of StatCounter. I don’t have a lot of confidence that their sample is representative of the worldwide market, especially when their “methodology” explanation is a single sentence.
- W3Counter is a freemium analytics service that claims to track 70,000+ websites worldwide. More than one-third of its traffic comes from the United States, it mixes mobile and desktop traffic with no way to segregate the data, and it counts only the most recent 15,000 visits to each site. Its numbers fluctuate so wildly as to be unbelievable. In July 2013, for example, W3Counter said Internet Explorer’s share of usage was under 22 percent. By October 13 (two weeks before the launch of a new Windows version), IE's share had skyrocketed to more than 29 percent. Four weeks later it was back under 22 percent. Sorry, those numbers don't add up.
- Wikimedia publishes a consolidated report of traffic to all of the Wikimedia Foundation’s properties, mixing mobile and desktop data. The raw output from its server logs makes for interesting reading but is clearly not representative of the larger world.