Photos: Learning from disaster

Visitors Center
Visitors are educated about earthquake technology and how scientists measure and predict quakes at the Visitors Center at the U.S. Geological Survey in Menlo Park, Calif.
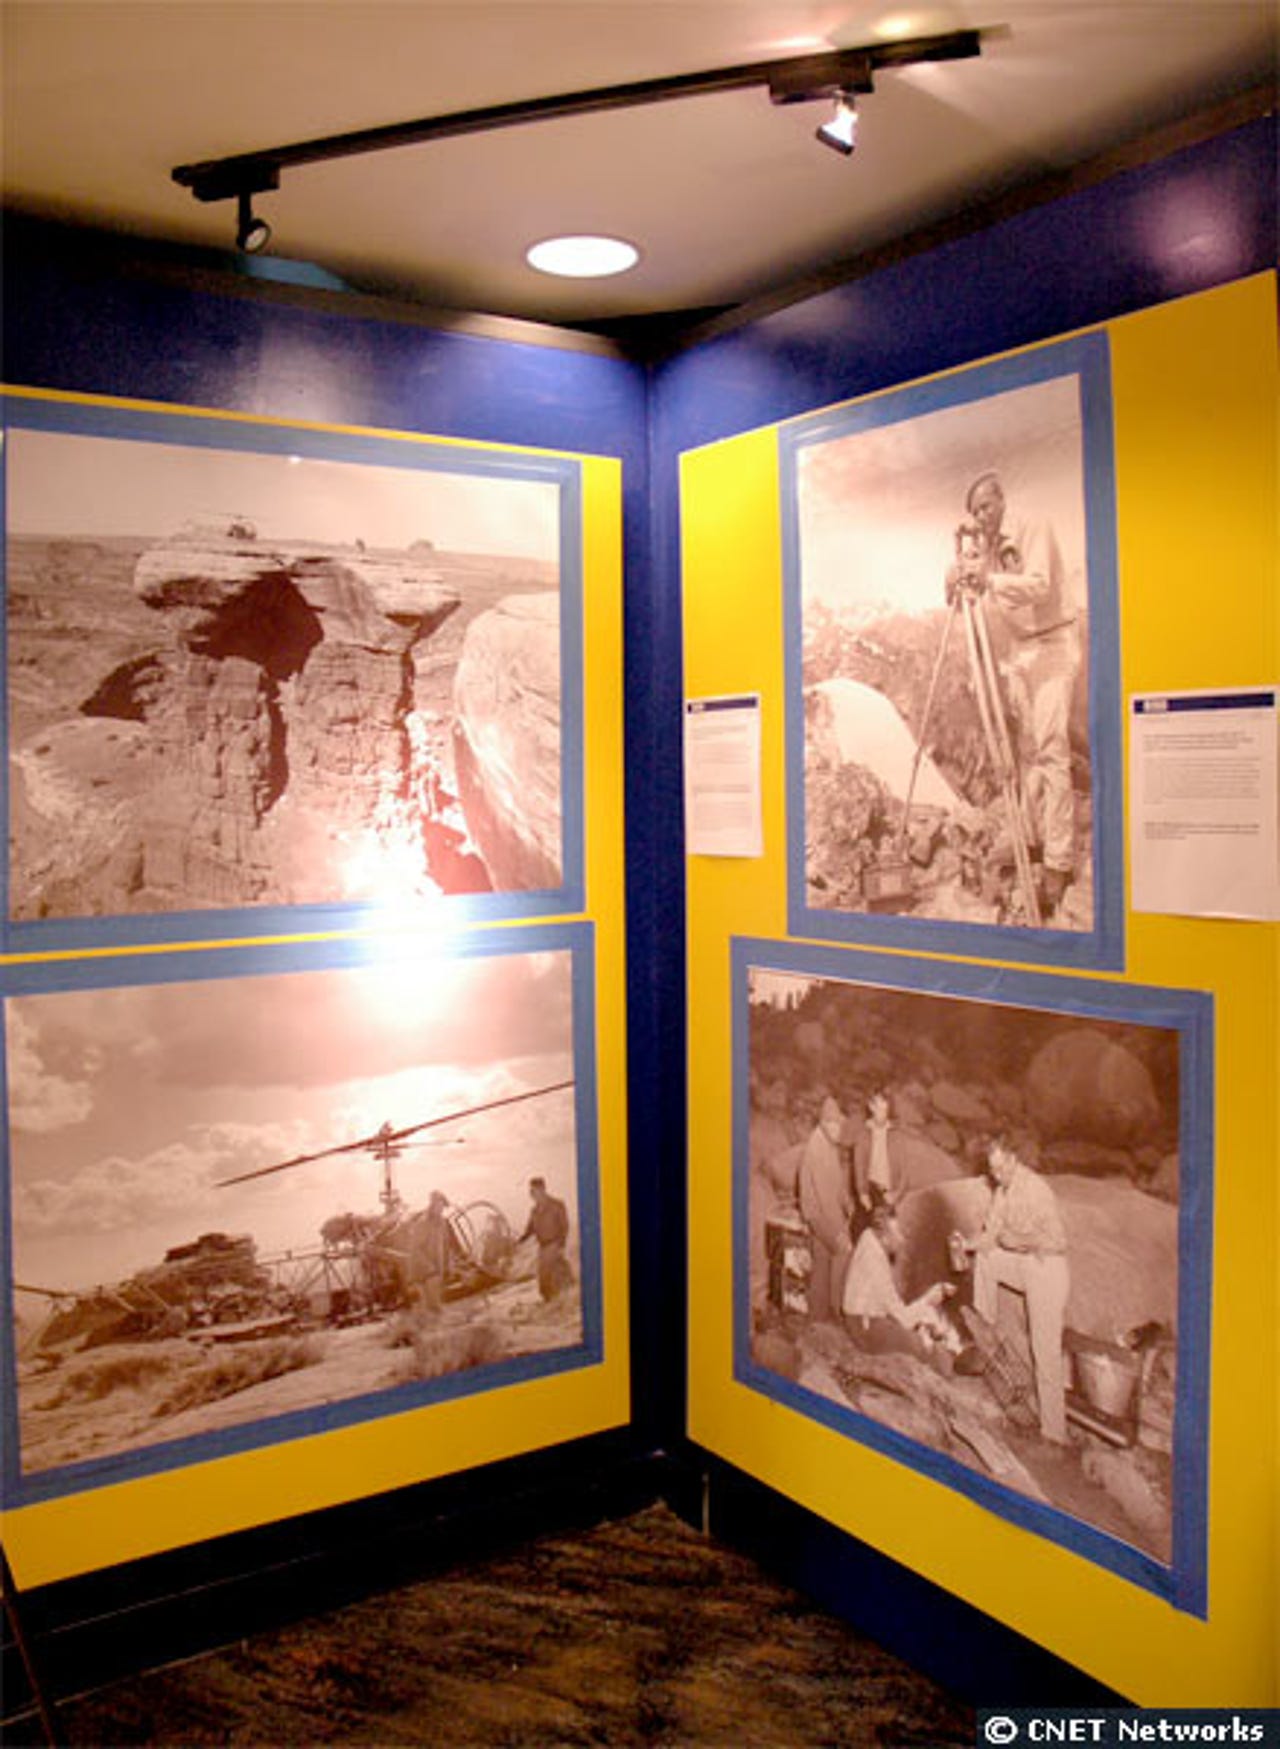
San Andreas Fault
Pictures of the San Andreas Fault grace the walls of the entrance to the Robert E. Wallace Earthquake Center at the U.S. Geological Survey in Menlo Park, Calif.
Brad Aagaard
Geophysicist Brad Aagaard of the U.S. Geological Survey creates computer animations to map the strength of earthquakes in California.
Sacramento Delta
A computer-animated mapping details shaking intensity in the Sacramento Delta.
Seisometer
Instruments like the seisometer help scientists determine the strength of an earthquake.
Slickensides
A plaster cast of "slickensides," parallel striations on rock surfaces produced by relative motion across opposite sides of fault planes, along the Hayward Fault at the U.S. Geological Survey Map Center in Menlo Park, Calif.
Mitch Adelson
Cartographer Mitch Adelson of the U.S. Geological Survey in Menlo Park, Calif., sells topographic maps such as this to visitors from all parts of the country.
U.S. Geological Survey
The U.S. Geological Survey in Menlo Park, Calif., houses rows and rows of maps of fault lines in the U.S.
Globe
Slips in the earth cause stress to fault lines, ultimately resulting in an earthquake. Scientists at the U.S. Geological Survey use globes such as the one shown here to study the inner surfaces of the earth and how slips and stresses may occur.
Visitor Center
The Visitor Center at the U.S. Geological Survey in Menlo Park, Calif., catalogs earthquake surveys from past decades.
Poster
This poster is just one of the many that blanket the walls of the U.S. Geological Survey in Menlo Park, Calif., commemorating the San Francisco earthquake of 1906.