Finance
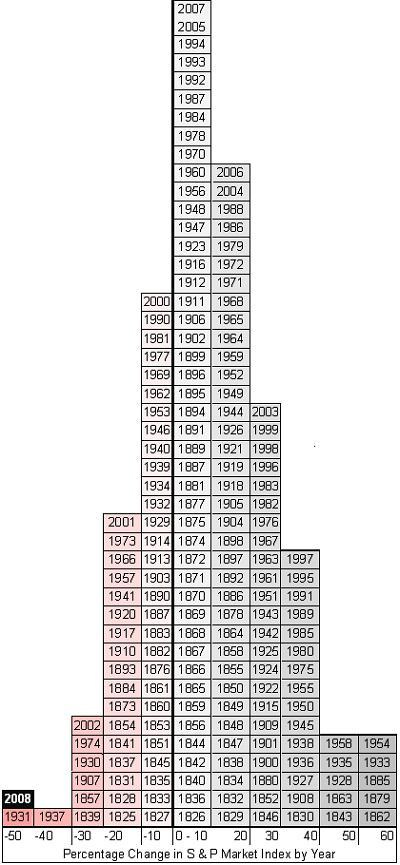
How bad is 2008 vs. S&P's 183-year history? Here's a graph
Here's a fantastic graph taken from, of all places, DailyKos, to illustrate the information found in the study "A New Historical Database For The NYSE 1815 To 1925: Performance And Predictability" by Yale's William N. Goetzmann and Roger G.

Here's a fantastic graph taken from, of all places, DailyKos, to illustrate the information found in the study "A New Historical Database For The NYSE 1815 To 1925: Performance And Predictability" by Yale's William N. Goetzmann and Roger G. Ibbotson and UC Boulder's Liang Peng.
The graph breaks down the S&P's performance from 1825 to present by placing each year into a column based on that year's annual returns, from -50% to +60%. There's a much larger and complex graph inside the study, but this version serves as a nice quick glance.
Just how historically bad is this year's market? Take a look.
