Monitoring Java applications with JConsole

How do you find out what is happening to a running Java application?
We may have questions like:
How much memory has it allocated on the heap?
What are the threads that are active?
What is the CLASSPATH or command line parameters that are set?
Questions like these cannot be answered easily without a management framework.
On the Java platform, the Java Management Extension or JMX is the monitoring and management framework. Sun has bundled JMX APIs in its distribution since JDK 5. There is an accompanying tool called jconsole which allows you to monitor and manage Java applications with JMX enabled.
In the following series of articles, we will look at:
- How to monitor existing Java applications with jconsole
- How to expose specific parts of your application to JMX. These includes exporting your application's attributes, operations and events to jconsole or any JMX compliant tools
- How to develop your own management client that integrates with JConsole
Enabling instrumentation
In JDK 5, Sun's Java Virtual Machine (JVM) has built-in
instrumentation that allows you to find out what is going on internally in a
currently executing application. However, the instrumentation is not enabled by
default. To enable the JVM for instrumentation, set the com.sun.management.jmxremote property to true. You can
do this from the command line using the '-D' option
java -Dcom.sun.management.jmxremote -jar Notepad.jar |
You can find Notepad.jar in $JAVA_HOME/demo/jfc/Notepad. Once the Notepad application has started, run JConsole. A window, as shown in Figure 1, shows which JVM has JMX enabled.
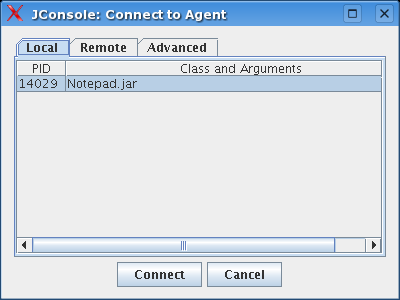
Figure 1 Select application to monitor
Select the application to connect to, if there is more than one, then click on Connect.
Once you have connected to the application, jconsole will display a summary of the resource utilization and environment settings of that application. An example of this is shown in Figure 2.
Figure 2 Summary of resources used in an application
The summary page shows
- the number of threads that are currently spawned in the JVM.
- the current and maximum heap size. It also displays garbage collector (GC) statistics and what is the collector that is currently used. In the example shown in Figure 2, we see that there are actually two collectors that are active. The one that is used in the young generation is the default collector called Copy while the collector that is used in the old generation is the Mark-Sweep collector. You will also be able to view some GC statistics like the number of collections that has occurred (Copy = 39 times) since the start of the application and the total time spend in the collection (Copy = 0.170 seconds).
- the number of classes that are loaded and unloaded in the permanent space of the heap
- the amount of memory in the operating system.
If you want to find out details about, for example, memory, click on the Memory tab. It will show you detailed information about memory utilization at specific intervals during the lifetime of the application; see an example of this in Figure 3.
Figure 3 Detailed memory utilization statistics
You can also get statistics on utilization on specific parts of the VM's memory. I will leave Threads, Classes and VM for the user to explore.
One tab that is not represented in the summary page is the MBeans tab. MBeans are managed resources. Applications expose statistics and configurable items through MBeans. For example, the JVM exposes GC statistics through an MBean.
Figure 4 Memory MBean
In Figure 4, we see the memory MBean. An MBean consists of the following
[GC 1768K->1255K(2240K), 0.0014280 secs]
[GC 1767K->1258K(2240K), 0.0013810 secs]
[GC 1770K->1254K(2240K), 0.0015350 secs]
[GC 1765K->1257K(2240K), 0.0018940 secs]
[GC 1769K->1254K(2240K), 0.0013310 secs]
[GC 1766K->1253K(2240K), 0.0098100 secs]
[GC 1765K->1256K(2240K), 0.0011300 secs]
- operations that can be invoked. The memory MBean has an operation called 'gc'. This operation invokes the GC
- notifications or alerts that can be emitted by the MBean.
Security
Currently, if you enable instrumentation, any one with jconsole can connect to your application. This may not be
ideal for certain applications. You can enable protection using user
name/password, SSL, JAAS or a
combination of the previously mention methods. In this article, we will only look
at user name/password method. See here for information on configuring SSL and developing JAAS modules.
- Create a password file called mypasswords, for example. Add username and password into mypasswords in the following format: username<space>password. Spaces and tabs cannot be part of your username. Here is an example of two users with their corresponding passwords
Since the password file is in plain text, you will have to change the permission so that only the relevant users may be able to read it.
- Now you to give access rights to Fred and Barney. The default location of the access rights files is located in $JAVA_HOME/jre/lib/management/jmxremote.access. fred and barney can either have "readonly" or "readwrite". If you have "readwrite" access, this means that you can change the MBean like changing the 'Verbose' attribute (see above). Thus Fred and Barney will only have readonly access.
fred readonly
barney readwrite
Now start the Notepad application again, with the following options
java -Dcom.sun.management.jmxremote \ |
Note that you have to specify a port. In our case, this is 8005.
Start jconsole again; click on the Remote tab at the connect dialog box. Enter the connection details. See Figure 5 below:
Figure 5 Authentication
In JDK 6, instrumentation is enabled by default so you no longer need to specify com.sun.management.jmxremote property when you are starting your Java applications.
Further reading