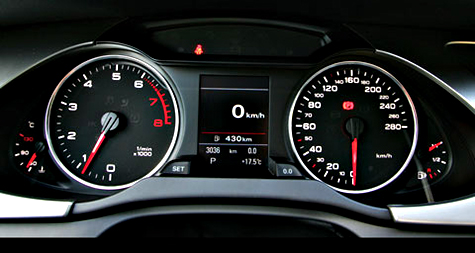
Building a great CIO dashboard


Enterprise dashboards summarize measurements and results of critical business functions into visual displays. In areas such as IT, it can be difficult to define useful metrics, because the performance measures may be highly complex or subjective. For example, determining accurate measures to answer the question, "Is our IT project on-track for success?" may be challenging.
Well-designed dashboards represent operational activities and results, relating them visually to key organizational goals and strategies. The key is selecting useful and meaningful metrics, determining how to collect data on these metrics, and then building a system that displays the data clearly to the intended audience.
Information Week's eight steps offer an excellent, business-oriented overview of this process:
- Define the key performance indicators (KPIs) that need to be measured in your dashboard.
- Map KPIs to specific data requirements. Determine if the data exists in systems or needs to be collected.
- If data-collection gaps exist, explore improvements to fill holes. Develop a plan and timeline to implement those systems.
- Investigate business service management, project and portfolio management, and BI tools based on your KPI requirements. Pay attention to how tools integrate with your existing infrastructure.
- Budget for the initial cost of the CIO dashboard, annual maintenance, and fees to implement the system. Take into account the complexity and cost of changes and updates.
- Develop an implementation plan that provides dashboard visibility into key systems one at a time.
- After systems are integrated, focus on correlating data across those systems to provide meaningful visual information and alerting capabilities should a metric violate a threshold.
- When new components are considered, evaluate how they'll be integrated into the dashboard.
Visit The Dashboard Spy to see interesting dashboards from many industries.