Mapbox mashes up with Tableau, other BI platforms

This year's Tableau Conference, kicks off with its keynote and first day of sessions in New Orleans today. As part of the festivities, Tableau and open source geographic information systems (GIS) player Mapbox, are announcing their Mapbox Geospatial Analytics Extension for Tableau.
The extension allows customers to easily aggregate spatial data into clusters and regular grids or transform the data into voronoi polygons or isobands. Sheets and dashboards in Tableau already look good. Add in some impressive map visualizations and things go from good to great.
Powering through
This comes on top of last week's announcement from Mapbox and from Microsoft, of the newest rev of the Mapbox custom visual for Power BI. The custom visual allows users of Microsoft's self-service BI platform to create 3D extrusions on shape maps, with adjustable height and pitch, as shown below.
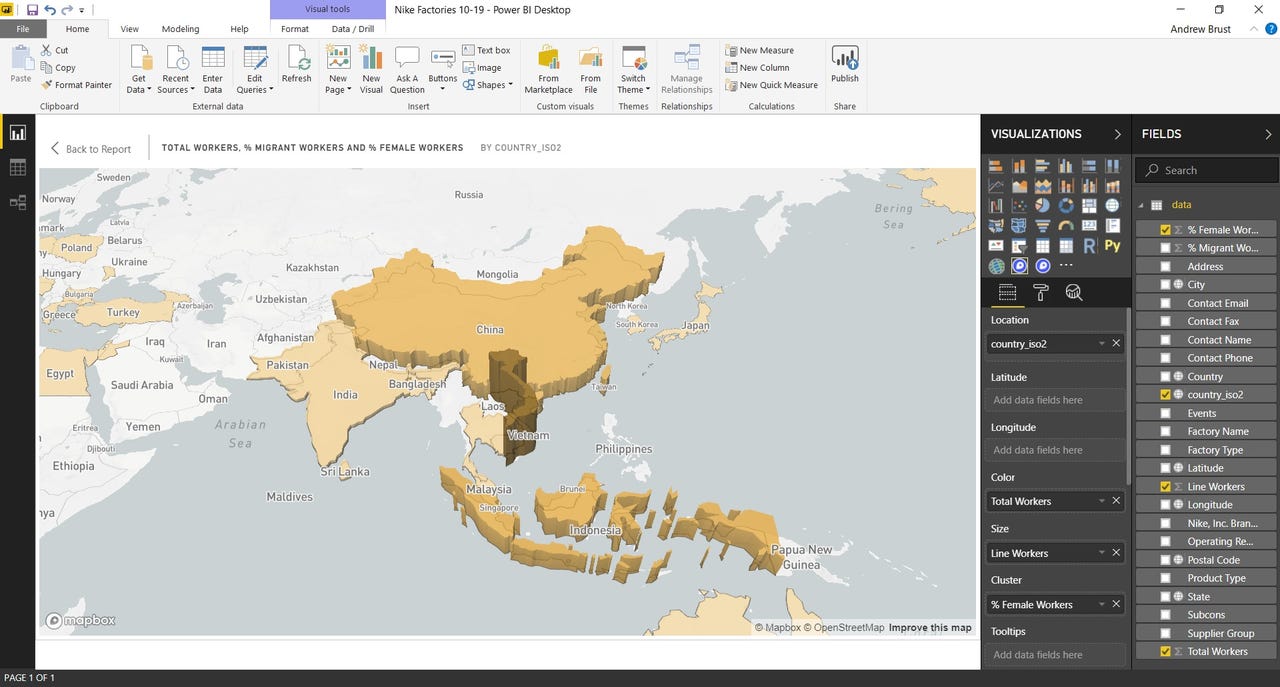
Power BI Desktop with a Mapbox custom visual, displaying 3D extrusions, in focus mode.
In both BI tools, the data in Mapbox visualizations can be filtered by selecting data in neighboring visuals on the same sheet/page. And if a geographic value is selected during such relative filtering, an auto-zoom feature in the Mapbox visualization will be triggered, so that the selected location comes right into focus.
I got hands-on with the Mapbox custom visual for Power BI myself (the above screenshot came from my own computer). And while there were a few prerequisites -- some of them less than intuitive -- to contend with, the overall ease with which the 3D extrusions can be set up is pretty darn impressive. What's even more impressive is that the custom visual is free.
Framework integration
It's not just commercial BI players (MicroStrategy is another one of those, by the way) getting in on the Mapbox game.
Also read: MicroStrategy 10.11 ups the front-end ante
The folks at Uber announced, also last week, that the latest release of their open source deck.gl data visualization framework (v6.2) is now integrated with Mapbox GL JS's latest release (v0.50).
The integration between the two tools allows developers to add layers into the same WebGL context that a Mapbox map is rendered in. In other words, Mapbox GL JS v0.50 allows much more sophisticated mashups between Mapbox and other frameworks/libraries. Moreover, Mapbox says the Custom Layers feature works with other WebGL rendering libraries, including three.js.
Not the only game in town
While Mapbox is doing cool stuff with BI vendors and in the developer ecosystem at large, they're not alone. ESRI, with its ArcGIS technology, has been at this for years. ESRI makes a product called ArcGIS Maps for Microsoft Power BI and also integrates with MicroStrategy and with Tableau, among others.
ArcGIS is a commercial software vendor, but Mapbox is not unique in being an open source provider in the GIS space. In that department there's also the open source vendor Boundless (which was founded by ESRI alumni), not to mention the open source QGIS system.
Also read: DataStax acquires DataScale; Boundless open GIS gets ecosystem
All of this is great for the customer. With all the public data sets, free BI tools and open source GIS and visualization platforms, budget is no longer a barrier to cutting edge visual analytics.