At Columbia University virtual conference, masters ply the strange and beautiful art of knowledge graphs
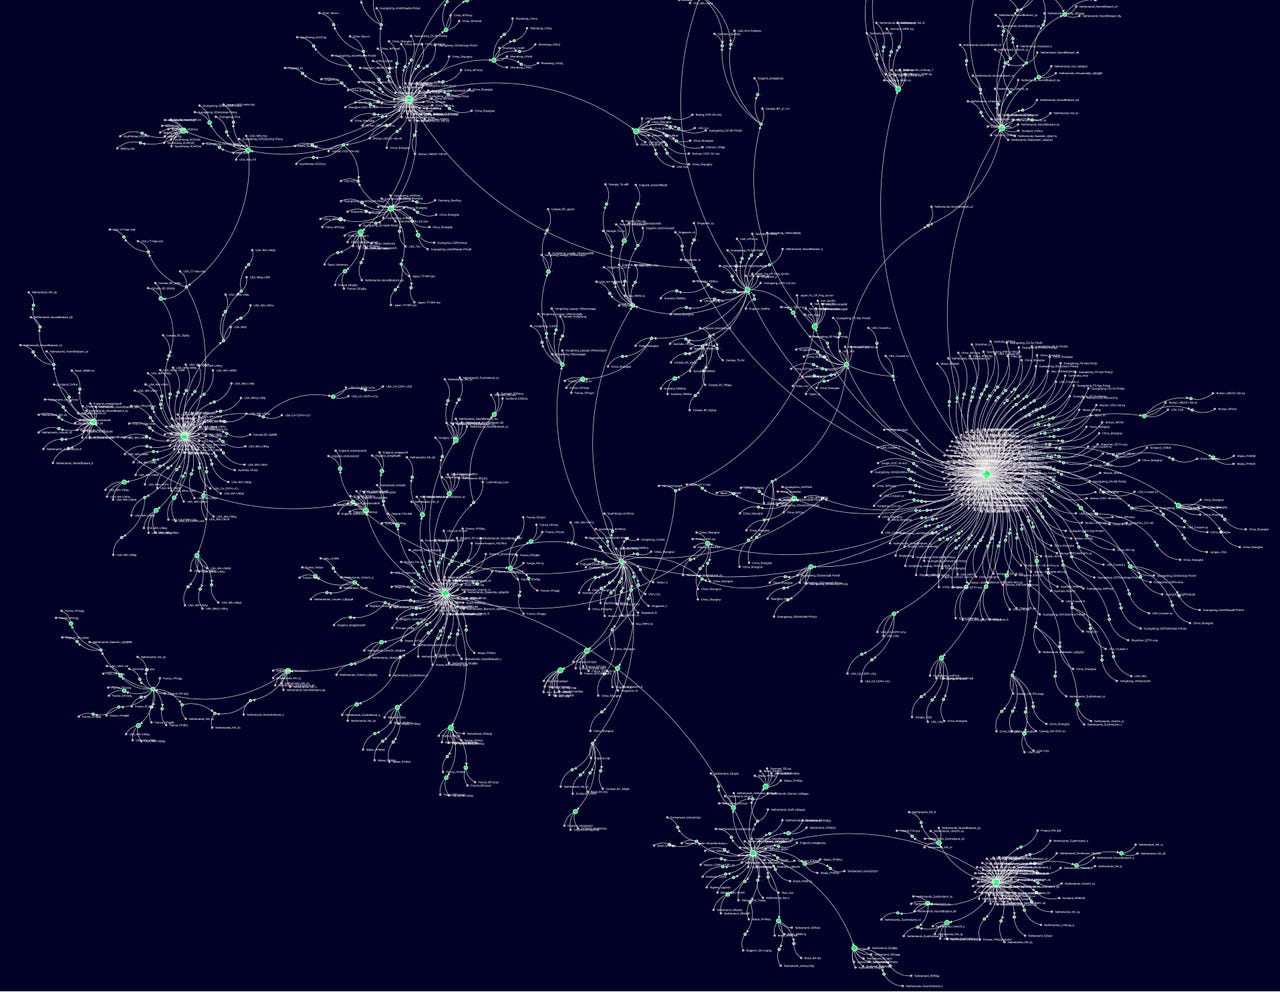
A "knowledge graph" of the COVID-19 disease's many "strains" created by startup Graphen.ai. Each dot is a strain of COVID-19 or a family of COVID-19, the lines show how one strain descends from another.
Everyone who has tried to figure out something has experienced the pleasure of seeing how things fit together — connecting the dots, or following the money, as they say.
One of the most fascinating technologies in vogue is a tool that can automate the process of making connections.
Called a knowledge graph, it gathers up all the data trapped in various databases and in emails and digital repositories of all sorts, and draws conclusions about how they fit together.
Some virtuosos of the knowledge graph were strutting their stuff this week at a conference held by Columbia University, the second annual Knowledge Graph Conference. Last year's meeting took place in the University's upper-Manhattan campus, while this year, because of COVID-19, it was virtual, streamed via Zoom. Question and answer sessions with speakers were lively on the accompanying Slack discussion channels.
The magic of knowledge graphs lies in their intuitive appeal: they represent things in the world as "nodes" in a network of connections, rather like the social network that has become familiar to most people in the form of Facebook. In a network, one thing over here is "linked" to that thing over there. A graph is simply the mathematical way to represent a network. As a graph, the network is represented visually in diagrams as a bunch of circles, the nodes, representing things in the world, and lines drawn between them, the "edges," representing the relationship of one thing to another thing.
These graphs can be networks of anything, from customers and orders, to taxonomies of species and their genetic linkages, to particles and their chemical bonds.
In hot pursuit
What is most magical about the constructions is that in the hands of their practitioners, they are a verb, not a noun. A traditional database sits there, a pile of stuff like addresses, names, weights, volumes, pixels, digits. It's static. The knowledge graph, in contrast, is a process, a picture coming into focus as more nodes and edges join together, filling in the blanks.
Also: In love with the graph: Neo4j spreads the obsession of a new database one app at a time
The picture could be a mundane sort, something as banal as what products a given customer ordered. When a link is drawn from those same products to another customer, two individuals become joined in the knowledge graph by their mutual product affinity. (Think, "Customers who bought this also bought…")
But the beauty of the graph lies in more striking associations.
Examining COVID-19 is one such example. Chen Yong Cher, the lead technologist at Graphen.ai, a New York startup, showed how the company's graphs map the mutation of the disease. Each node in the graph is a "strain" of the virus, a version, marked by a change in the recipe of amino acid particles of the virus. In Cher's visualization, which can be seen on the Graphen Web site, threads like spider silk showed the relation of one strain to another as ancestors or descendants, as the virus has moved from one region of the world to another, mutating repeatedly.
The work of knowledge graphs is a kind of detective work, drawing revelatory connections among things one might not have thought to associate otherwise.
Real estate is a good place to look
Take real estate. Ron Bekkerman, a computer scientist who is the chief technologist of another New York startup, Cherre Inc., asked the audience to reflect on a striking disparity of information: The stock market, where prices are posted, and the real estate market, where prices are mostly hidden, or, at least, hard for the average individual to get ahold of.
"In the stock market, you actually know the price of the asset, but what about The Empire State Building? Do you know the price of The Empire State Building?" asked Bekkerman, rhetorically.
"With Amazon [stock], you can make a decision how to invest in it," he observed. "You can't really say the same about a building. Do you know if it's making money or losing money? Do you know if it's fully occupied, or half-empty? There's not that much information."
"What can we do?" he asked. "We need to connect bits and pieces together, we need to build the knowledge graph." Cherre uses artificial intelligence techniques to take databases, some public, some private, and figure out where in the graph those objects sit, what their relationships are to one another.
AI scientist Ron Bekkerman walks audience members through how his firm, Cherre, finds hidden relationships in real estate. In this case, the trail of properties leading from Donald J. Trump to another real estate mogul.
Also: Uber's graph expert bears the scars of billions of trips
Bekkerman put a slide up for the audience as an example of the sleuthing. Donald J. Trump, president of the United States, is also a real estate mogul. Links spread out from Trump, as Node One, if you will, to various properties the Trump real estate empire has been involved in, constituting other nodes in the graph.
Through the network of properties, an edge at some point led to Paul Van Dien Davis, the late real estate mogul. The process of making connections established a link between Trump and Davis. "This is not publicly known," Bekkerman told the audience.
This process of working through property records can accomplish what Bekkerman refers to as "owner unmasking," revealing property owners who may have deliberately concealed themselves from public scrutiny.
AI to automate the hunt
Investors will pay money for this kind of information, and Bekkerman's company sells a subscription service that uses knowledge graphs to find just such answers for clients. He cited a few use cases, including predicting whether a property that is not currently in distress may at some point become distressed because it has links to properties already in distress.
The nodes and the edges are too vast to connect all of this by hand, explained Bekkerman. "We very quickly end up with so many nodes, we will not find what we are looking for." Instead, Bekkerman and team use artificial intelligence methods to reveal hidden relationships.
Using AI is the new wave in graphs, and was discussed by everyone at the conference. In the case of Cherre, the company creates its own custom-built AI software to do the analysis. "Off-the-shelf deep learning approaches don't work well in graphs," Bekkerman told ZDNet, referring to the dominant form of densely-layered neural networks.
Instead, Cherre uses something called "geometric deep learning," which Bekkerman told ZDNet works better for graph-based information. The work draws upon a central concept in AI, "attention." Attention goes back to the work of Yoshua Bengio of Canada's MILA institute for AI.
The principal of attention is one of filling in the blanks by finding what fits with a given context. Looking in the fridge to find "_____" to make an omelette is pretty obviously a statement about a carton of eggs for most people. A machine fills in the blanks by manipulating what's called a vector, a grouping of numbers that belong together, and finding the way each node in a graph can be related to another by a similarity of their vectors.
In the hands of an artisan like Bekkerman, making software to compare all the various vectors of a knowledge graph is like gently rolling the dials of a combination lock till some affinity clicks, revealing the hidden connection.
"In our knowledge graph, the use case is finding similar nodes by traversing the graph," he told ZDNet, "where the traversal is guided by the attention vector."
"Traversing," in this case, is the verb for how a computer program follows the links between nodes, seeing where things lead.
"Similar nodes should have similar attention values," he explained. "And since those values are used for detecting similar nodes, this leads us to a very interesting deep learning architecture, tailored for the task in hand."
Bekkerman, who has worked at numerous startups and also large companies — he was a founding member of the data science team at LinkedIn — has done his own pioneering work in machine learning. He received a PhD from the University of Massachusetts at Amherst for inventing a novel approach to what's called "Markov random fields," a way to uncover how different things depend on one another by the way they are linked in a graph. He is no stranger to diving into huge real-world data sets, especially intriguing kinds of data sets. A report he co-authored in 2004 used machine learning to sort the thousands of emails from the Enron scandal.
Ambition and wonder
The Cherre work on real estate, just like the Graphen.ai picture of COVID-19, and many other projects discussed at the conference, share a similar kind of gusto. It's not hubris, but a thrilling will to believe that knowledge graphs are coming closer to unearthing the Order of Things in the world. The term "ontology" was tossed around at the conference. It is a technical term, but it also implies a general belief that by uncovering things, the practitioners are getting at something more fundamental than agglomerations of data.
"We do want be the single source of truth when it comes to commercial property pricing," Bekkerman told ZDNet of Cherre's mission. "By integrating most (all?) real estate data sources, we have a chance to monitor everything that's going on in the real estate market, and based on that we can build a very precise valuation mechanism that takes into account all the factors we monitor."
Cherre's knowledge graph could become "prescriptive" of asset values, rather than "suggestive," in the case of Zillow, he said.
"We will then become the Dow Jones of real estate," he offered.
The scale of the ambition is not surprising given how much is to be organized in the world. The entire "digital universe" consists of 50 "zettabytes," Vassil Momtchev of tech firm Ontotext told the audience Thursday morning. Each zettabyte is a billion, trillion bytes. That's more than there are stars in the observable universe, he pointed out.
Despite large numbers, there is a secondary appeal to knowledge graphs: they seem to bring back the relevance of human knowledge. Even though things can be automated, there is still a place for an editor of sorts. "The thing about data work is that it is fundamentally people work," scientists Paul Groth of the University of Amsterdam told the audience.
He cited the example of the collaborative data store known as Wikidata, run by the Wikimedia Foundation. "It is really based on the work of people," he said, "a bunch of editors and a lot of human curation."
Machines, he suggested, can augment, not displace, the labor of humans.
"We have to think about how we integrate people and machines in a unified environment," Groth declared.
The big picture
Someone with a very long perspective had to give a shape to both the ambition and the wonder of it all. And that was the conference's honored speaker, John Sowa. Sowa, a fellow with the Silicon Valley AI startup Kyndi, Inc., is known for his pioneering work in the 1970s at IBM, in which he applied graphs to databases. Collections of links between objects were a more natural way for a person to interface with information, he argued way back then.
The world has caught up with Sowa. He was given an award at the conference for "outstanding contribution to the field of knowledge engineering."
At the end of his talk, titled, "Relating Knowledge Graphs To Logic, Language, and the World," Sowa showed a slide with quotes from two logicians, Alfred North Whitehead and Charles Sanders Pierce, and a poet, Robert Frost.
All three were on to something that goes to the heart of knowledge graphs, he suggested. The logicians approached the problem of knowledge as a matter of approximation, to bring the state of things gradually into focus.
Sowa illustrated Frost with a quote by the poet about his work. For Frost, knowledge is something like a will to live.
"I go so far as to say that every poem is a momentary stay against the confusion of the world…," wrote Frost. "We rise out of disorder into order. And the poems I make are little bits of order."
So, too, the knowledge graph crowd seek to rise out of disorder. An interesting imperative in virus times.
Honored speaker John Sowa, a pioneer of knowledge graphs, directed the audience to focus on the big picture, the human need for understanding.