China: IT Salary Benchmark 2010

ZDNet Asia conducted an online survey between October 2009 and November 2010, to gain insights into salary trends and the IT workforce in Asia.
The study polled a total of 14,998 respondents from various sectors including government, healthcare, IT, services, telecommunications, legal and finance, and across eight Asian economies: China, Hong Kong, India, Indonesia, Malaysia, the Philippines, Singapore and Thailand.
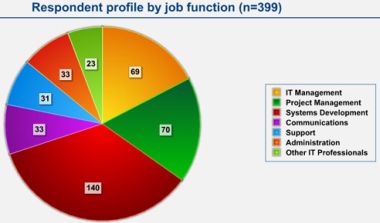
There were 389 respondents from China, holding full-time positions with job functions that cut across several areas such as systems development, project management and support.
In addition, six respondents from the economy were either contract or independent consultants, while another four held part-time positions, working fewer than 28 hours a week.
Respondents who performed systems development duties in the government, education and healthcare sector were the highest paid among their peers in China, pulling in an average salary of 300,000 yuan a year.
In the following charts, RMB denotes the Chinese yuan.
Average annual salary by IT skills and years of experience (RMB)
IT Skills | Years of Experience | ||
|---|---|---|---|
Less than 5 years | 5-10 years | More than 10 years | |
| Application Development | 75,921 | 156,447 | 245,994 |
| Web Development | 92,667 | 140,652 | - |
| Servers/Networking | 77,757 | 128,304 | 204,036 |
| Enterprise Applications | 71,677 | 146,825 | 226,060 |
| Operating Systems | 98,757 | 132,706 | 205,800 |
| Desktops/Software | 84,682 | 137,483 | 209,948 |
| IT Outsourcing | 67,623 | 156,371 | - |
| Database Management | 88,654 | 136,195 | 239,948 |
| Systems Administration | 72,893 | 139,504 | 218,415 |
| IT Security | - | - | 221,761 |
| Infrastructure Management | - | 130,267 | 228,643 |
| Consulting/Business Services | 96,686 | - | 259,989 |
Average annual salary by job function and years of experience (RMB)
Job Function | Years of Experience | ||
|---|---|---|---|
Less than 5 years | 5-10 years | More than 10 years | |
| IT Management | 77,273 | 152,426 | 255,511 |
| Project Management | 80,938 | 172,457 | 230,062 |
| Systems Development | 79,740 | 155,051 | 201,682 |
| Communications | 87,929 | 93,143 | 280,000 |
| Support | 110,804 | 104,643 | 98,750 |
| Administration | 88,944 | 118,926 | 300,000 |
| Other IT Professionals | 46,360 | 112,000 | - |
| Overall | 80,778 | 143,929 | 233,471 |
Average annual salary of top 10 most popular IT skills (RMB)
Rank | % of Respondents | IT Skills | Average Annual Salary |
|---|---|---|---|
| #1 | 51.5 | Application Development | 142,501 |
| #2 | 34.2 | Operating Systems | 137,780 |
| #3 | 33.4 | Enterprise Applications | 147,208 |
| #4 | 33.4 | Servers/Networking | 124,620 |
| #5 | 31.3 | System Administration | 141,112 |
| #6 | 31.3 | Desktops/Software | 135,919 |
| #7 | 24.8 | IT Outsourcing | 142,002 |
| #8 | 24.5 | Database Management | 148,835 |
| #9 | 24.5 | Web Development | 139,185 |
| #10 | 22.9 | IT Security | 140,415 |
Average annual salary by job function and industry (RMB)
Years of Experience | ||||||
|---|---|---|---|---|---|---|
IT, Web & Telecom | Government, Education & Health | Legal & Finance | Media, Marketing & Sales (non-IT) | Manufacturing, Services & Others (non-IT) | Overall | |
| IT Management | 180,350 | 210,114 | 277,300 | 141,333 | 152,667 | 180,783 |
| Project Management | 166,932 | 156,667 | 193,333 | 167,500 | 136,700 | 164,358 |
| Systems Development | 110,322 | 300,000 | - | 220,000 | 28,500 | 112,698 |
| Communications | 143,667 | 53,500 | - | 100,000 | 54,000 | 114,219 |
| Support | 100,897 | 140,333 | 97,000 | - | 106,545 | 106,466 |
| Administration | 114,306 | 55,667 | 190,000 | 168,000 | 65,400 | 107,358 |
| Other IT Professionals | 82,538 | 35,000 | - | 48,057 | - | 67,245 |
| Overall | 129,864 | 142,200 | 203,086 | 117,120 | 110,413 | 130,305 |
Select country to view related salary figures.