Cloudera adds data engineering, visualization to its Data Platform

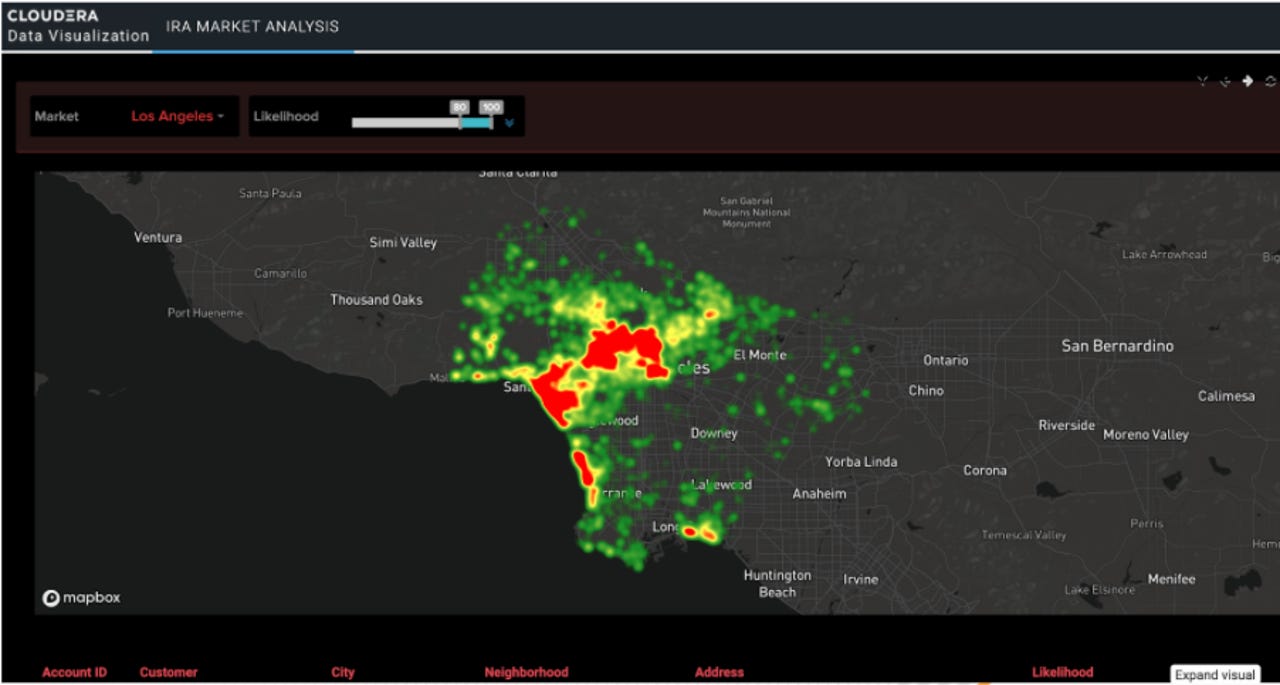
A mapbox heatmap in Cloudera Data Visualization
In conjunction with day two of its virtual Cloudera Now event, Cloudera is announcing new data engineering and data visualization "experiences" within its Cloudera Data Platform (CDP). These complement a new operational database, also announced today, and covered in depth by Tony Baer in a separate post.
Must read:
- Cloudera adds operational database to cloud service
- Cloudera Data Platform launches with multi/hybrid cloud savvy and mitigated Hadoop complexity
- Cloudera Data Platform Private Cloud announced
CDP already offered data hub, data warehouse and machine learning components, among others. Now, the new components, Cloudera Data Engineering and Cloudera Data Visualization, add ETL and BI chops. A contingent from Cloudera, including Senior Product Marketing Manager Santiago Giraldo, briefed ZDNet on the details.
Data engineering as team sport
Cloudera Data Engineering (CDE) seems the more strategic of the two offerings. Cloudera is bringing CDE to market because it sees data engineering maturing from a task done by one or two people in a specific business unit to project-oriented work addressed by autonomous data engineering teams that may be servicing multiple clients/constituencies. In that scenario, manually running data engineering code in a notebook won't cut it. Instead, enterprise deployment, versioning, scheduling and management is needed.
Examining job performance metrics in Cloudera Data Engineering
As such, CDE's focus is on those operational facets of data engineering jobs, rather than authoring of those jobs. For the latter, data engineers can create scripts in the various languages supported by Apache Spark (CDE's underlying execution engine) and deploy those to CDE. But Cloudera also says that pipelines authored in certain third party partners' ETL and data prep platforms (with Informatica and Trifacta mentioned specifically) can be deployed to CDE as well.
Once the scripts or pipelines are deployed, customers can use CDE within CDP's Shared Data Experience (SDX) to schedule, monitor and manage the jobs (Cloudera provides a command line interface as well, however). CDE uses Apache Airflow to schedule the job runs and deploys them as Kubernetes containers. It also creates REST endpoints for the deployments, allowing them, for example, to be triggered from code running in Amazon Web Services (AWS) Lambda, possibly in response to the arrival of a data file in S3.
Data viz in the data platform
Cloudera Data Visualization (rendered output from which is shown in the figure at the top of this post) provides visual dashboard, reporting and charting capabilities within CDP's Cloudera Data Warehouse and Cloudera Machine Learning. The technology came to Cloudera from its 2019 acquisition of Arcadia Data, and it features the natural language querying capabilities Arcadia had as a standalone product.
Also read:
- Cloudera acquires Arcadia Data, shows Q2 improvement
- Arcadia Data brings natural language query to the data lake
Cloudera Data Visualization isn't meant to compete with banner BI offerings like Tableau or Microsoft's Power BI, but rather provide in-situ data visualization capabilities that analysts and data scientists can use without having to leave CDP. The visualization assets can be packaged and run as applications, thus far exceeding the more rudimentary data viz capabilities built into Jupyter notebooks, and the like.
Cloudera Data Engineering is generally available (GA) within CDP on AWS. Cloudera Data Visualization is in technical preview; Cloudera expects it to reach GA later this calendar year.
Cloudera is a customer of Brust's advisory firm, Blue Badge Insights.