Google Sheets updated with data analysis, visualization tools

Although it is not the most glamorous of apps in Google's vast catalog, spreadsheet editor Sheets is being tweaked to make larger data sets more digestible.
At the most visual level, users will be able to preview formula results while typing, revealing both progress and potential errors nearly instantly.
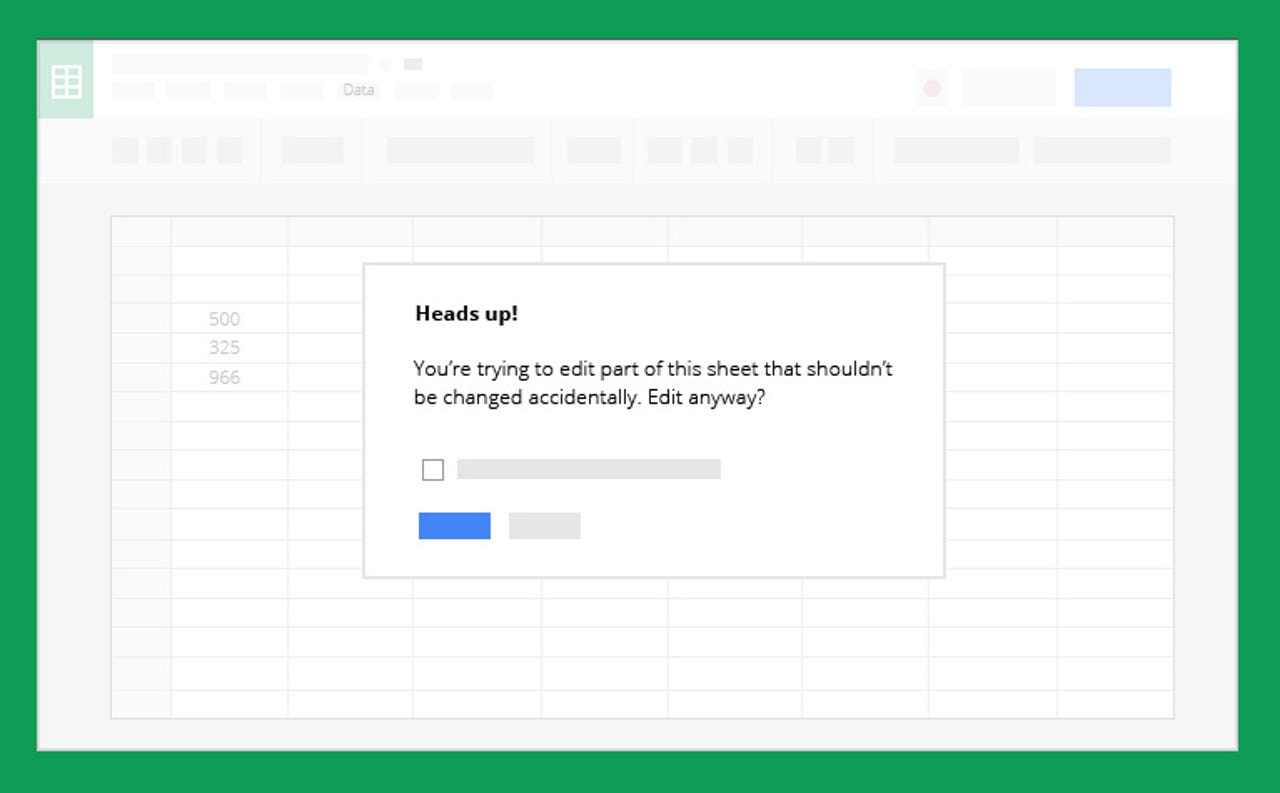
In another effort to stave off errors -- or lost work altogether -- file managers can restrict editing to a specific set of users and a specific range on a given sheet.
"The more the merrier when it comes to collaborating in Sheets, but sometimes you need to take extra steps to preserve your hard work from accidental edits," wrote Google product manager Dan Gundrum in a blog post on Monday.
Thus, there's still room for collaboration, but with optional invisible parameters. The restrictions will present themselves as warnings to other file editors.
Worker bees can also add labels or change icons altogether (i.e. stars, geometrical shapes, etc.) to distinguish values of bars or points on a chart.
Diving deeper into calculations and analysis, Sheets has been prepared for a few new functions, like adding calculated fields to apply formulas to pivot table data and the "GETPIVOTDATA" function for retrieving data from a pivot table.
Users can also filter rows and columns by certain conditions and attributes, honing in and displaying only certain numbers and text.
These new Google Sheets features are accessible on the Web starting today.
Image via Google