Miracles happen: a transparent gov't dashboard

Failed government projects often remain hidden behind layers of bureaucratic obfuscation, only to be revealed after an agency has wasted substantial time and money.
Given this, imagine my surprise upon learning of a state agency providing the public with genuine transparency and openness with web-based, real-time project status reporting.
The Washington State Transportation Improvement Board (TIB) developed its Performance Management Dashboard as an internal oversight tool during a period of fiscal crisis. From the Dashboard Spy:
The background material is that the agency was almost bankrupt. Clear and simple, although, very scary. Prior commitments were coming due and the agency was not in a position to pay out the pending millions of dollars in bills.
From those humble beginnings, the dashboard has grown into a real-time reporting system showing fine-grained project status across Washington State.
Although this dashboard covers transportation construction projects, it could easily be adapted to IT projects. For that reason, it should serve as a role model and inspiration to the government IT community. You can try the dashboard yourself by clicking here.
Here's the opening screen. Note the balanced scorecard approach:
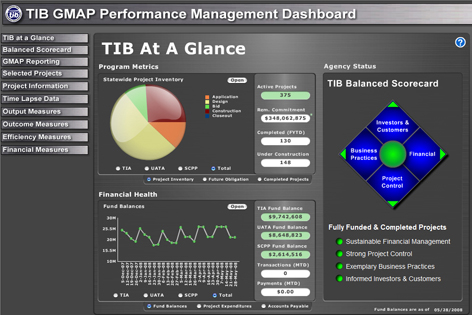
The overview displays the number of projects in each county. The green, yellow, and red status designations offer a simple, effective method for monitoring a project portfolio:
Detail screens include a description of the project, map, photographs, and an alert if the project is delayed:
The Executive Director's Watch List openly describes the state's most challenged projects:
The Delayed Projects screen presents an overview of troubled projects:
Another great example of transparency, this time showing over-budget projects:
No one enjoys sharing his or her problems publicly. However, transparency prevents denial, which is a symptom of almost all IT failures. Any organization committed to IT transparency will have fewer failures, as TIB experienced:
TIB’s highest order goals have been met. TIB met performance targets for minimum account balance and payment turn-around time in July 2007 after six years of clearing out the excess inventory from over-programming. Delayed projects dropped 70 percent from 2002 to 2008 because of performance tracking in the dashboard and customer contacts triggered by missed date benchmarks. Payment turnaround time has dropped from five months to an average of 17 days. Most convincingly, the dashboard helped restore legislative confidence; TIB received a new allocation of permanent ongoing funding in 2005 and a new program.
Transparency and openness, whether in government or the private sector, is difficult for reasons we all understand. However, successful results are the reward to those organizations willing to honestly face their own project truths.
Know of similar IT project dashboards? If so, please leave a comment.