Tableau makes Johns Hopkins coronavirus data available for the rest of us

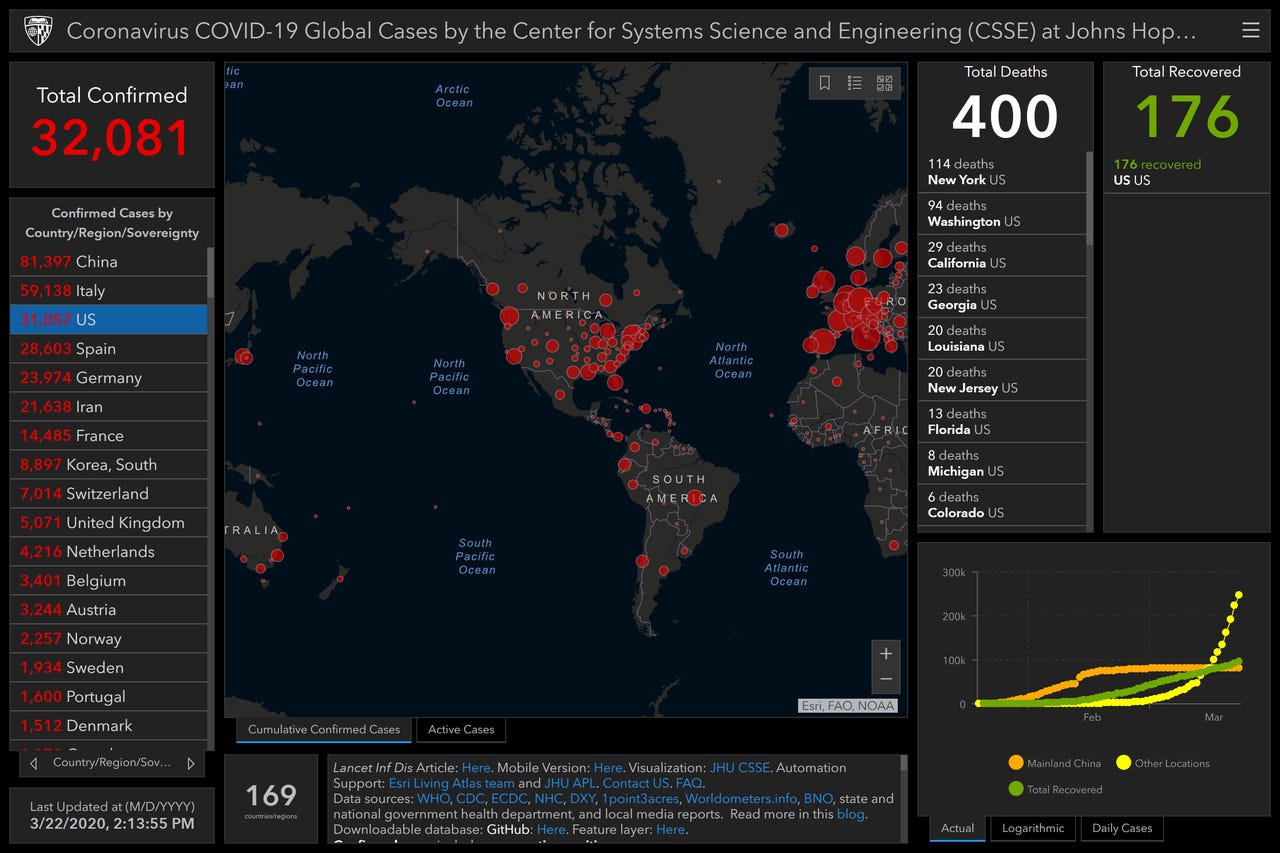
Johns Hopkins' COVID-19 Global Cases Interactive Dashboard
Coronavirus
I'm a data person and, if you're reading this, you probably are too. I like to be informed about, and maintain control over situations. Data helps me with the former and at least provides the illusion of attaining the latter. While the COVID-19 crisis is impossible to control, and the figures around it can be stress-inducing, analyzing the data and understanding it a little better does provide some level of understanding that can help.
Johns Hopkins provides coronavirus data
With that in mind, you may be aware that Johns Hopkins University's (JHU's) Center for Systems Science and Engineering (CSSE) maintains a continuously updated dashboard of the virus' spread, based on officially reported case counts from around the world, and pictured in the figure above. While that dashboard itself is useful, pulling the data down from Hopkins' GitHub repo and doing your own analysis on it can be a little tricky.
With this in mind, Tableau took a look at that data, did its own data engineering/ETL work on it and has published the output of that effort as its COVID-19 Data Resource Hub. Within the Resource Hub site, the consolidated data is available in Tableau's own .hyper and .tde formats, and also available in Google Sheet and CSV formats, making it compatible with BI tools beyond Tableau.
Tableau makes it more accessible
On Friday, I spoke with Steve Schwartz, Director of Public Affairs at Tableau, and Sarah Goehri, Tableau's Corporate Communications Manager. With each of us working from home, talking to each other via headsets and web cams, Schwartz explained to me that with the company's establishment of Tableau Foundation, it now has a track record of working with data sets surrounding global health subject matter (more info on that here). Because of that, and because it found the JHU data difficult to work with in its raw form, Tableau decided to do the data engineering work and make the data available to everyone.
Tableau has published a rather simple "starter dashboard" based on the data, and made it available on Tableau Public. It has also set made the .hyper, .tde and CSV versions of the data set available through online data catalog platform data.world. While this creates an "extra hop" to get to the data, access is still relatively straightforward and enhances its availability on all platforms – not just Tableau. It also facilitates collaboration and discussion around use of the data set itself, something data.world explicitly focuses on.
Catalog shopping with data.world
When you visit the data.world repository for Tableau's version of the JHU Coronoavirus data, you'll need to sign in. Assuming you don't already have a data.world account, you can connect via Google, Facebook, GitHub or Twitter credentials, then change the password on your data.world account to something unique and secure.
Once that's done, you can enable integration with your BI platform via the "Open in App" option, then use the data.world connector for one of the supported platforms (including Microsoft Power BI, Excel, MicroStrategy, Google Data Studio, Plot.ly, Jupyter notebooks, RStudio and many others) to gain access to the data. That connection process will require you to supply owner, dataset id and query information that data.world will present to you for simple copying and pasting into the connection dialog that is invoked.
Because my own skill set in Microsoft Power BI is much stronger than it is for other tools, I chose to analyze the data there. Power BI Desktop is a free download and includes a beta data.world connector. Power BI Desktop runs only on Windows, though it can be hosted within other operating systems via certain virtualization platforms. (For example, Mac users can run Power BI Desktop using Parallels).
Measures, dimensions and granularity
Once you're connected to the data, you'll see its schema is relatively straightforward. The granularity of the data is at the date level, per geography – either country_region or, for certain countries, province_state (in certain cases, the granularity may drill down even a bit lower – see details below).
The data set's measures are "cases" and "difference," which provide cumulative and daily cases totals, respectively, per day, for each tracked geography. Case_type is an in important dimension, as it lets you filter or break down by active cases, deaths, recoveries, and total confirmed cases. To avoid double counting, you should either look only at confirmed cases, or else look only at one or all of the other types (since rows with "Confirmed" cases essentially represent the sum of corresponding rows with case_type of "Active," "Deaths" and "Recovered").
The country_region and province_state names will let you map the data, but if you'd prefer not to use location names, "lat" and "long" columns provide latitude and longitude data that can be used as well. Another column, simply called "location" provides lat/long data together in POINT(long, lat) format. The latest_date column reports data of the data set's the most recent data and prep_flow_runtime would seem to provide the date and time that Tableau's data prep process was run.
Surprisingly, I found that using lat/long sometimes provides multiple data points per province_ state, ostensibly including a generic data point and for the entire area as well as some more location-specific ones, the latter often having zero or a relatively small number of cases. I would advise exercising caution around this feature in the data set's granularity.
Visualizing the data
Once you've connected to and loaded the data, visualizing it is relatively straightforward. While it's not clear whether that's a blessing or a curse, it does help certain things become clear. I filtered the data to exclude rows with case_type = Confirmed so I could perform analysis across data with case-type values of Active, Deaths and Recovered.
I share some of these analyses with you below. Please note that Tableau provides the data on an as-is basis, and I do the same with my analyses. None of the analyses presented below has been rigorously vetted, and they're current only to Saturday, 3/21/2020, based on values in the latest_date column in the data set.
That said, depending on your tolerance for news, you may wish to keep reading, or else stop here.
Let's start with the obvious. Here's a bubble map aggregating all novel covid-19 active cases in the US (including Alaska, Hawaii, Puerto Rico and Guam):
Coronavirus active cases in the US, including all 50 states, Puerto Rico and Guam
A simple combo chart of the cases and difference columns by the date column shows just how much we need to flatten the proverbial curve. Here's the chart for New York State, with total active cases plotted as a line and new active cases as columns:
Total and new active cases, by date, for New York State. Line shows total case count; columns visualize number of new cases, each day, starting on March 8th, 2020.
We're used to seeing maps and plots like these in news coverage. They can be intimidating, overwhelming and, honestly, they're not very detailed. What I found most useful about the Tableau-supplied data set was that it gave me the ability to go deeper and perform more specific analyses.
For example, you can also look at the countries with the highest number of cases, breaking down by case_type. I did this by creating a stacked bar chart, sorted by case count in descending order, showing the seven most affected countries, excluding China (since its case count so dominates the others). When I ran this on Saturday, the US was in fifth place (again, excluding China). When I refreshed the data this morning, the US had unfortunately pulled into second place, with only Italy having more cases:
Stacked column chart of active cases, deaths and recoveries, for highest impacted countries, excluding China.
You can drill down to the individual country level, too. Here's a pie chart of active cases by province_state, filtered by country, that reveals the ratio of cases in Hubei province, relative to others in China:
Active cases in China, by province, with Hubei dominating
And here's the corresponding chart for the US, with New York State, Washington State and California, dominating, in that order:
US Cases, by state. As of March 21st's data, New York State accounted for nearly half of them.
Adding a timeline filter and setting the effective date back 10 days, to March 11th, can show how Washington State had the most number of cases at that time. Ten days makes a big difference, as we've learned, and as this visualization shows.
Time machine rewind: US Coronavirus active cases by state, as of March 11th
We can analyze the data using a more free form approach, as well. Power BI's Q&A feature allows querying the data in relatively plain English. To test this, I asked Q&A to show me the number of newly reported deaths, per day, in the US, starting on March 1st, by entering "difference by date for Deaths and US as area chart on or after March 1 (date)." Here's what I got back:
I should point out that the data I'm getting back from the Hopkins data set does not seem to match up with the data reported in New York Governor Andrew Cuomo's news conference this morning (Cuomo's numbers were likely more recent and therefore, unfortunately, higher). Though nothing seems available yet, I am keeping my eye on the open data sites for both the City and State of New York, to see if I could add their data to my analysis, in the future.
I'll do my best to end on a positive note. Here's what I got back when I asked Q&A to show me cumulative, global "Recovered cases by date":
We're getting close to 100,000 recoveries. Let's hope this curve gets steeper, not flatter, until the crisis has passed.
The column chart visualization showing the seven countries with the highest number of cases (excluding China) was updated, at 10:46pm ET on Monday March 23rd, to correct the fact that the original version was not filtered on the current date. As such, on the Y axis, the original was showing a false aggregation of every day's cumulative total, which produced a meaningless figure, overstated by an order of magnitude. The text describing that visualization was updated as well.
The map and three pie chart visualizations were updated at 11:11pm ET, to correct the same error.