Tablets Hold Their Own – And Then Some – In Work-Related Application Usage

Tablets drive worker productivity in part due to their hyper-portability, as I argued in a recent blog post. Workers can (and, we showed with data, do) use tablets in more places, places where they wouldn’t (and don’t) take their PCs.
The top question I’ve received about tablet hyper-portability is this one: “Tablets are very portable, sure, but are people using them as creation devices or as (mere) consumption devices?” The general assumption behind this question tends to be that “creation” activities are equal to “productivity,” while “consumption” activities are not. I believe this is a false dichotomy, however. Consuming the right information at the right time can increase worker productivity in and of itself. Let me offer a few examples showing how that can work:
- Retail sales associates using tablets with customers. Retailers are equipping sales associates with tablets to use on the retail floor, creating richer interactions with customers – and driving higher sales.
- Physicians conducting patient rounds with tablets. Physicians can gain rich, immediate insight into their patients’ health records – saving time and driving more accurate diagnoses in less time. They also use the tablets to show patients results (like x-ray images), creating a better patient experience.
- Sales professionals using tablet presentation tools. A variety of presentation apps, including Slideshark, Keynote, and, on Windows 8 and RT tablets, native PowerPoint, allow sales people in all verticals to use tablets as a presentation platform – educating buyers and driving higher sales.
All of these scenarios are both physically mobile and also – interestingly – customer-facing activities.Yet tablets can do far more than even these examples suggest. It’s actually not hard to find a writer who composed an entire novel on an Apple iPad with a Bluetooth keyboard. Nor is it hard to find workers who travel with only a tablet on business trip, leaving their laptops behind.
To get a more rigorous picture of how workers use PCs versus tablets, Forrester’sForrsights Workforce study surveyed information workers about their use of 26 work applications. We compared those who use PCs (the vast majority of information workers) to the 21% of information workers who use a tablet for work. We found that 9 of the 26 applications were “PC dominant”: The penetration rate of usage of those apps was higher on PCs than on Tablets. That means that 17 apps turned out “Tablet dominant.”
Let me start off with one clear disclaimer: There is a significant early adopter bias among tablet users today. Even at 1 out of 5 of all information workers, tablet users remain early market adopters with more technological savvy and higher incomes than PC users (who represent almost allinformation workers). Self-selection means that these early adopters are going to use *any* technology to its fullest, so we expect them to push tablets to their limits.
Even with that bias in mind, however, we can see that tablets can be used productively across a wide variety of applications. I’ve plotted the differences in penetration rates (i.e. PC penetration rate minus Tablet penetration rate), yielding the curve below:
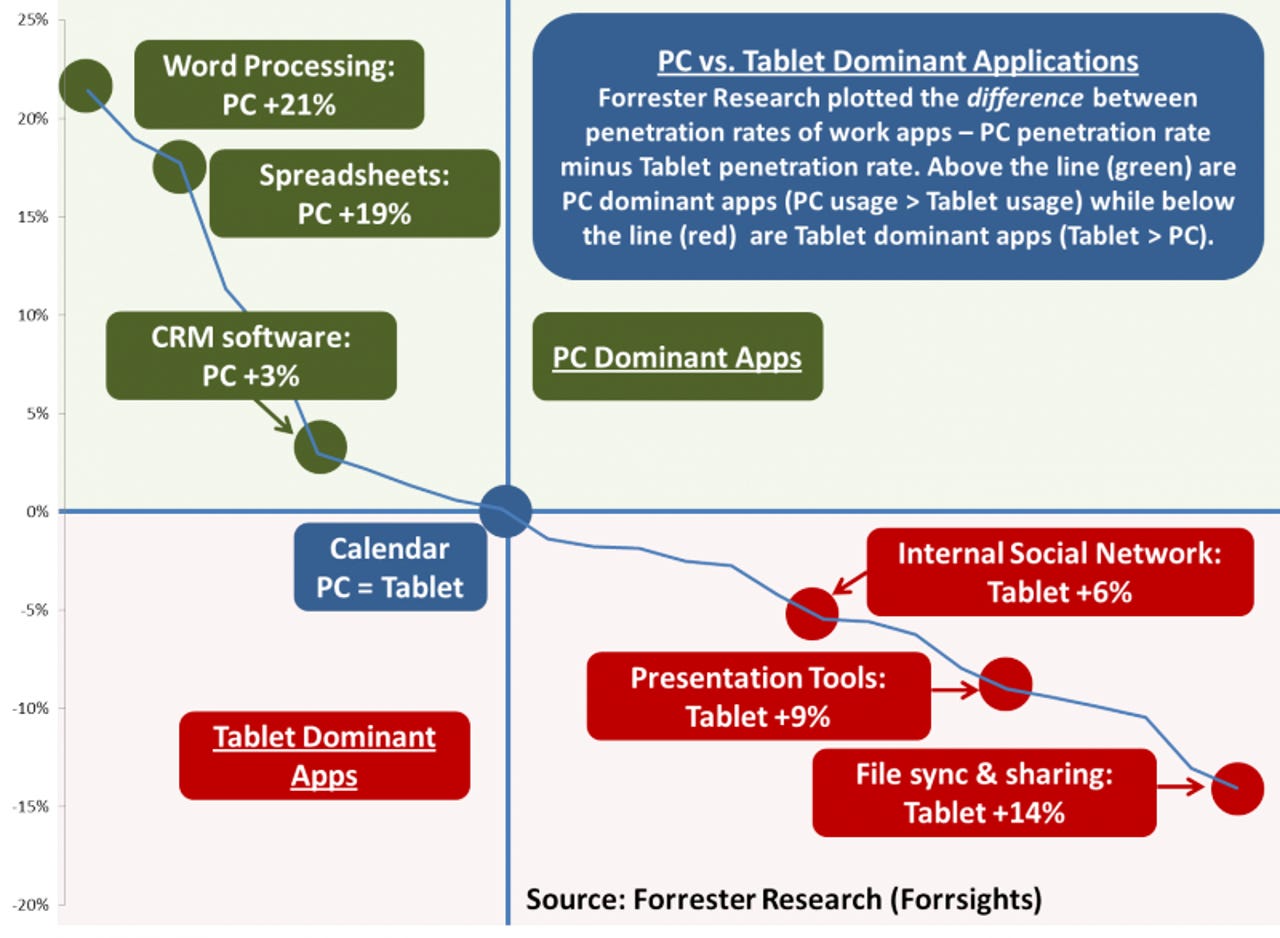
The green region (above the x axis) shows PC dominant apps. These include unsurprising work-horse applications such as word processing (PCs lead Tablets by 21 percentage points) and spreadsheets (PCs lead by 19 points).
Toward the middle, we find CRM software (PCs lead by a meager 3 points). CRM software can be useful in a consumption context; imagine the sales professional consulting Salesforce.com on her tablet right before a meeting with a prospect. Calendaring ties: PCs and Tablets enjoy the exact same usage rate (which is 46% of information workers using each device -- see the second chart, further below).
The red region (below the x axis) shows Tablet dominant apps. These include file sync & sharing (Tablets lead by 14 percentage points). This supports what I call “device hand-offs” – starting a document on a PC or Mac, continuing working on this document on a tablet, then sharing back and forth via cloud services. (Example: Using Pages to create a document using both a Mac and an iPad, continuously synchronizing the file via iCloud). Presentation tools (Tablets lead by 9 points) probably involve doing the presenting on the tablet having created the presentation on a PC or Mac. Other Tablet dominant apps include a lot of social networking and communications activities.
The conclusion here is that tablets are being used dynamically and deeply for a wide variety of work-related applications. At least among early adopters who can take great advantage of their best features, tablets hold their own (and better) compared with traditional laptops in app usage. And all of these activities, whether "creation" or "consumption," are driving worker productivity.
As a final bonus, a few of the penetration numbers behind the analysis. The percentages in the "PC" and "Tablet" columns represent the percentage of (global) information workers who say they engage in each application on that specific device for work purposes: