Thailand: IT Salary Benchmark 2012

ZDNet Asia conducted an online survey between March 2011 and March 2012 to look into the pay packages Asia's IT professionals were receiving and related market trends.
The study polled a total of 945 respondents from various job functions varying from administrators and support to IT management and systems development, and across seven Asian economies: China, Hong Kong, India, Indonesia, Malaysia, the Philippines, and Thailand.
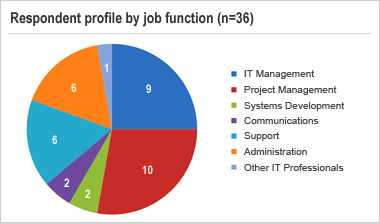
Thailand contributed 36 participants to the survey. Of these, 12 of them had less than 5 years of working experience in the industry and 14 had between 5 and 10 years, while 10 had more than 10 years' worth of experience.
In terms of pay, industry experience proves significant as the top earners in the Thai IT market belonged mostly to those in the more than 10 years experience bracket, with an average annual salary of 819,750 baht.
In the following charts, THB denotes the Thai baht.
Average annual salary by IT skills and years of experience (in THB)
IT skills | Years of Experience | ||
|---|---|---|---|
Less than 5 years | 5-10 years | More than 10 years | |
| Data Center | 346,800 | - | - |
| System Administration | 355,000 | 600,500 | 289,000 |
| Servers/Networking | 355,000 | 709,000 | 839,500 |
| Application Development | 660,000 | - | - |
| Desktops/Software | 406,667 | 664,857 | - |
| Storage | 406,667 | 483,333 | - |
| Operating Systems | 406,667 | 709,000 | 326,000 |
| IT Security | 406,667 | 478,400 | 440,000 |
| Web Development | 406,667 | - | 1,600,000 |
| Enterprise Applications | 393,333 | - | 1,600,000 |
| IT Outsourcing | - | 800,000 | 1,600,000 |
| Database Management | - | 862,500 | - |
| Infrastructure Management | - | 418,000 | 1,086,667 |
| Consulting/Business Services | - | 1,700,000 | 1,119,500 |
| Telco/Wireless/Mobile | - | - | 1,990,000 |
Average annual salary by job function and years of experience (in THB)
Job Function | Years of Experience | ||
|---|---|---|---|
Less than 5 years | 5-10 years | More than 10 years | |
| IT Management | 1,000,000 | 850,000 | 569,500 |
| Project Management | 625,000 | 610,000 | 1,000,000 |
| Systems Development | - | 600,000 | - |
| Communications | 500,000 | - | 400,000 |
| Support | 360,000 | 327,000 | 500,000 |
| Administration | 338,000 | 600,000 | - |
| Other IT Professionals | - | - | 2,380,000 |
| Overall | 498,222 | 637,231 | 819,750 |
Average annual salary of Top 10 IT skills (in THB)
Ranking | % of Respondents | IT Skills | Average Annual Salary |
|---|---|---|---|
| #1 | 60 | IT Security | 458,933 |
| #2 | 56 | Servers/ Networking | 645,143 |
| #3 | 56 | System Administration | 485,857 |
| #4 | 48 | Operating Systems | 537,667 |
| #5 | 40 | Desktops/ Software | 587,400 |
| #6 | 32 | Consulting/ Business Services | 1,172,250 |
| #7 | 32 | IT Outsourcing | 792,500 |
| #8 | 32 | Data Center | 372,750 |
| #9 | 28 | Infrastructure Management | 716,286 |
| #10 | 28 | Storage | 450,000 |
Average annual salary by job function and industry (in THB)
Job Function | ||||||
|---|---|---|---|---|---|---|
IT, Web & Telecom | Government,
Education & Health | Legal & Finance | Media,
Marketing & Sales (non-IT) | Manufacturing,
Services & Others (non-IT) | Overall | |
| IT Management | 816,333 | 480,000 | 600,000 | - | 700,000 | 742,000 |
| Project Management | 780,000 | 180,000 | - | - | - | 680,000 |
| Systems Development | 600,000 | - | - | - | - | 600,000 |
| Communications | 450,000 | - | - | - | - | 450,000 |
| Support | 342,000 | - | - | - | 396,667 | 374,800 |
| Administration | 500,000 | 500,000 | - | - | 314,000 | 469,000 |
| Other IT Professionals | 2,380,000 | - | - | - | - | 2,380,000 |
| Overall | 731,524 | 731,524 | 600,000 | - | 440,800 | 644,200 |