The carbon footprint of spam (infographic)

Even though the rules about what is and isn't spam seem to have relaxed (does anyone else receive way more unsolicited phone calls and emails than they used to?) I'm sure that it still annoys you as much as it annoys me. Moreso because many of you are responsible for protecting your organization against it.
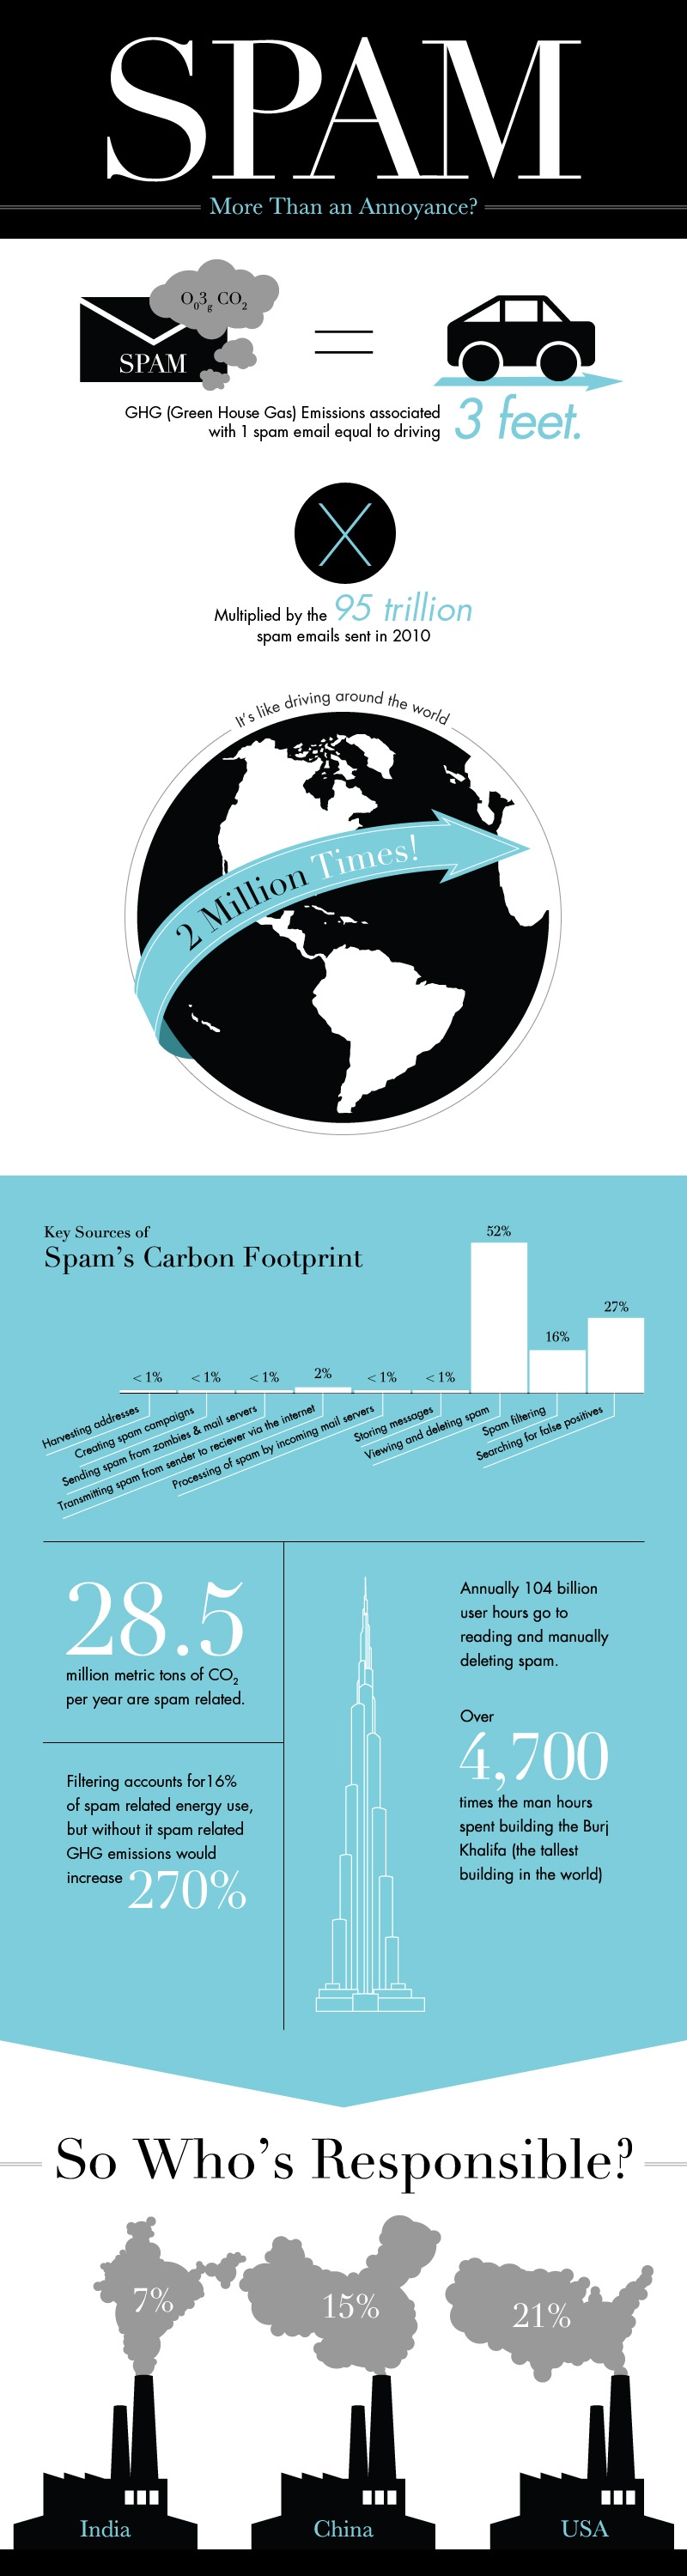
That's why I thought that GreenTech Pastures readers would get a kick out of this fun infographic from Web site WebpageFX that attempts to calculate the carbon footprint of all that stuff that lands in your junk folder (if you are lucky). The graphic appears below.
Infographic by WebpageFX
You need to exercise a certain amount of open-mindness when you consider this graphic. Really, how do we know that 1 spam email equals 3 feet of driving? But that is just the surface level. If you think about all the servers needed to send spam PLUS all the servers needed to deliver it PLUS the servers need to eradicate it, you'll realize that the IT infrastructure resources applied to the problem are not insubstantial.
Obviously it would be next to impossible to eliminate some of those anti-spam resources. For example, filtering accounts for 16 percent of the spam related energy use, but if you took it away, there would be more spam. So it is a tradeoff.
Something to think about next time your company starts looking at security budgets and what to cut.