The Web browser wars continue, and #1 is… well, that depends on whom you ask

In some ways, the "winner" of the top desktop browser wars doesn’t really matter. As end users, as long as we have a choice of Web browser, we can pick the one whose interface works for us. But browser numbers matter a lot more when you're a software developer trying to understand who's most likely to use your Web application – or to complain about it not working right. That's especially true, too, when you support business users inside a company, since there's just so many desktop configurations any sane sysadmin can maintain.
Which makes these two competing desktop Web browser market share reports all the more confounding.
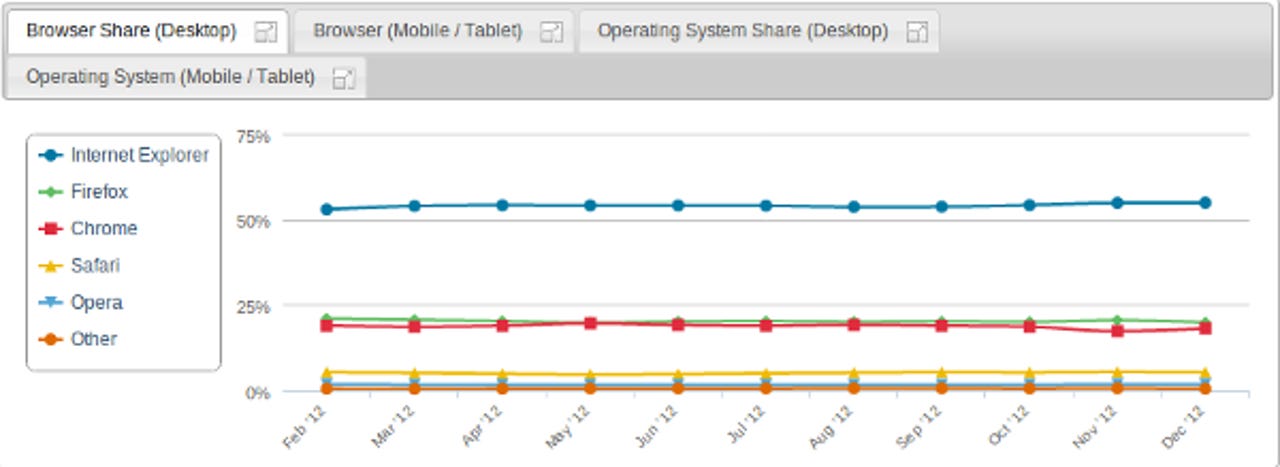
If you buy Net Market Share's desktop Web browser numbers, then in December 2012 Internet Explorer (IE) was still in first with 55% of the market with Firefox leading Google Chrome 20% to 18% for second place. But, if you put your faith in StatCounter's browser statistics, then Chrome ended 2012 as the top browser with 36% and IE is number two, 31%, with Firefox lagging behind at 22%. What's going on here?
First, while both companies have the same general goal—measuring Web browser popularity—they use different methodologies. Ultimately, they're not really measuring the same thing, or even trying to do so. Net Applications, Net Market Share's parent company, is more interested in counting unique visitors' Web browser hits, while StatCounter looks at raw browser hits.
Officially, here's StatCounter Web browser tracking methodology:
Our tracking code is installed on more than 3 million sites globally. These sites cover various activities and geographic locations. Every month, we record billions of page views to these sites. For each page view, we analyze the browser/operating system/screen resolution used and we establish if the page view is from a mobile device. For our search engine stats, we analyze every page view referred by a search engine. For our social media stats, we analyze every page view referred by a social media site. We summarize all this data to get our Global Stats information.
We provide independent, unbiased stats on Internet usage trends. We do not collate our stats with any other information sources. No artificial weightings are used (http://gs.statcounter.com/faq#no-weighting). We remove bot activity (http://gs.statcounter.com/faq#bots)and make a small adjustment to our browser stats for prerendering in Google Chrome (http://gs.statcounter.com/faq#prerendering). Aside from those adjustments, we publish the data as we record it.
In other words, we calculate our Global Stats on the basis of more than 15 billion page views per month, by people from all over the world onto our 3 million+ member sites.
[To] collect data from the browsers of site visitors to our exclusive on-demand network of HitsLink Analytics and SharePost clients. The network includes over 40,000 websites, and spans the globe. We ‘count’ unique visitors to our network sites, and only count one unique visit to each network site per day. This is part of our quality control process to prevent fraud, and ensure the most accurate portrayal of Internet usage market share. The data is compiled from approximately 160 million unique visits per month. The information published on www.netmarketshare.com is an aggregation of the data from this network of hosted website traffic statistics. In addition, we classify 430+ referral sources identified as search engines. Aggregate traffic referrals from these engines are summarized and reported monthly. The statistics for search engines include both organic and sponsored referrals.
Net Market Share also massages the data by weighting it by a country's Web traffic, to balance out the global data. "We compare our traffic to the CIA Internet Traffic by Country table, and weight our data accordingly. For example, if our global data shows that Brazil represents 2% of our traffic, and the CIA table shows Brazil to represent 4% of global Internet traffic, we will count each unique visitor from Brazil twice.” Their reasoning is that all regions have differing markets, and without this adjustment, the global data would be inappropriately affected by those regions. In their view, country level weighting removes any bias by region.
Which methodology is "better" depends on your purpose. If all you want is numbers that reflect the sheer volume of Web traffic, then StatCounter is your source. If you care more about unique visitors, as do many Web advertisers, then put your trust in Net Market Share.
Google, of course, thinks Chrome is the the top dog Web browser and Microsoft, needless to say, believes IE is king of the mountain.
The whole question of which desktop Web browser is on top may seem a little old hat, but I think it's more important than ever Wewb Web applications are starting to become browser specific. For example, Google no longer supports Google Apps on IE 8—the newest version of IE that will run on Windows XP. So, if you run both XP and Google Apps, Chrome has become your default choice. Conversely, you can't run Chrome at all on Windows RT.
So it is that I think the desktop Web browser wars won't be cooling down at all in 2013. Indeed, I think they'll heat up more than ever.
Related Stories: