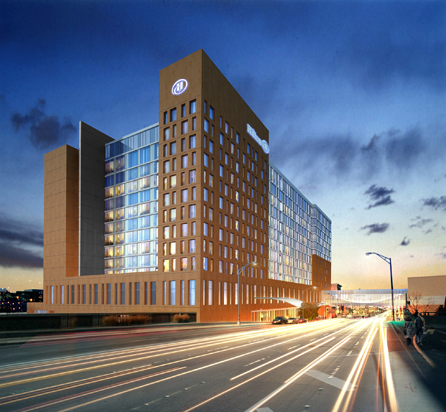
Top 20 service providers on 2012 corporate expense reports

Starbucks, Delta Airlines, Hilton Hotels and National Car Rental are the corporate names appearing most often on 2012 travel and entertainment expense reports.

These are the findings of research from Certify, a cloud-based expense management provider, based on travel & entertainment receipts and expenses from over six million transactions between January and November of 2012.
The usage patterns for these various brands in business travel points to leading restaurants, hotels, airlines and car rental services adopted within the United States. Overall, business travelers spent an average of $7.54 every time they went into a Starbucks. The most expensive popular restaurant chain was Panera's, in which business travelers spent close to $20 each time they visited. (That makes the WiFi service a worthwhile investment for these companies.)
Here are Certify's findings, across the major T&E categories:
Most Expensed Restaurants:
- Starbucks – 20,084 transactions averaging $7.54
- McDonalds – 12,419 transactions averaging $6.73
- Subway – 8,627 transactions averaging $11.88
- Panera Bread – 5,156 transactions averaging $19.12
- Burger King – 4,091 transactions averaging $8.45
Most Expensed Airlines:
- Delta – 20,164 transactions averaging $474.25
- United – 11,581 transactions averaging $492.42
- Southwest – 10,713 transactions averaging $282.38
- American – 8,856 transactions averaging $457.43
- US Airways – 7,284 transactions averaging $348.96
Most Expensed Hotels:
- Hilton – 18,254 transactions averaging $270.55
- Marriott – 12,979 transactions averaging $302.42
- Holiday Inn – 9,366 transactions averaging $227.51
- Choice Hotels – 4,716 transactions averaging $154.87
- Starwood Hotels – 1,824 transactions averaging $331.62
Most Expensed Rental Car Services:
- National – 8,667 transactions averaging $182.71
- Hertz- 7,868 transactions averaging $219.92
- Enterprise – 7,858 transactions averaging $204.68
- Avis – 3,824 transactions averaging $199.49
- Budget – 1,674 transactions averaging $174.42
This post was originally published on Smartplanet.com