Valentine's Day: 49% more new Facebook relationships

Facebook today released data on how relationships change with the seasons. Using U.S. Facebook data from 2010 and 2011, the company looked at how different times of the year affect the beginning and ending of relationships.
The Facebook data team tabulated the changes from a non-coupled relationship status (like "Single" or "Divorced") to a coupled status (like "In a relationship" or "Engaged") and then compared it against the number of changes in the other direction, from coupled to non-coupled. The net percentage changes are of course just estimates, as people don't always change their relationship status to accurately represent when they start a relationship (sometimes they want to delay becoming Facebook official) or when they break-up (sometimes they just hide it from their Facebook profile entirely instead of going back to "Single").
That being said, the days around Valentine's Day and Christmas are good times of the year to pair up than to go back to being single:
- February 14: 49 percent more new relationships than break-ups
- December 25: 34 percent more new relationships than break-ups
- December 24: 28 percent more new relationships than break-ups
- February 15: 22 percent more new relationships than break-ups
The fifth biggest day for a net increase in relationships was April Fools' Day, which saw 20 percent more relationship initiations than splits. Unsurprisingly, many of these were short-lived: April 2 was the year's most extreme day in the other direction, with 11 percent more break-ups than new relationships.
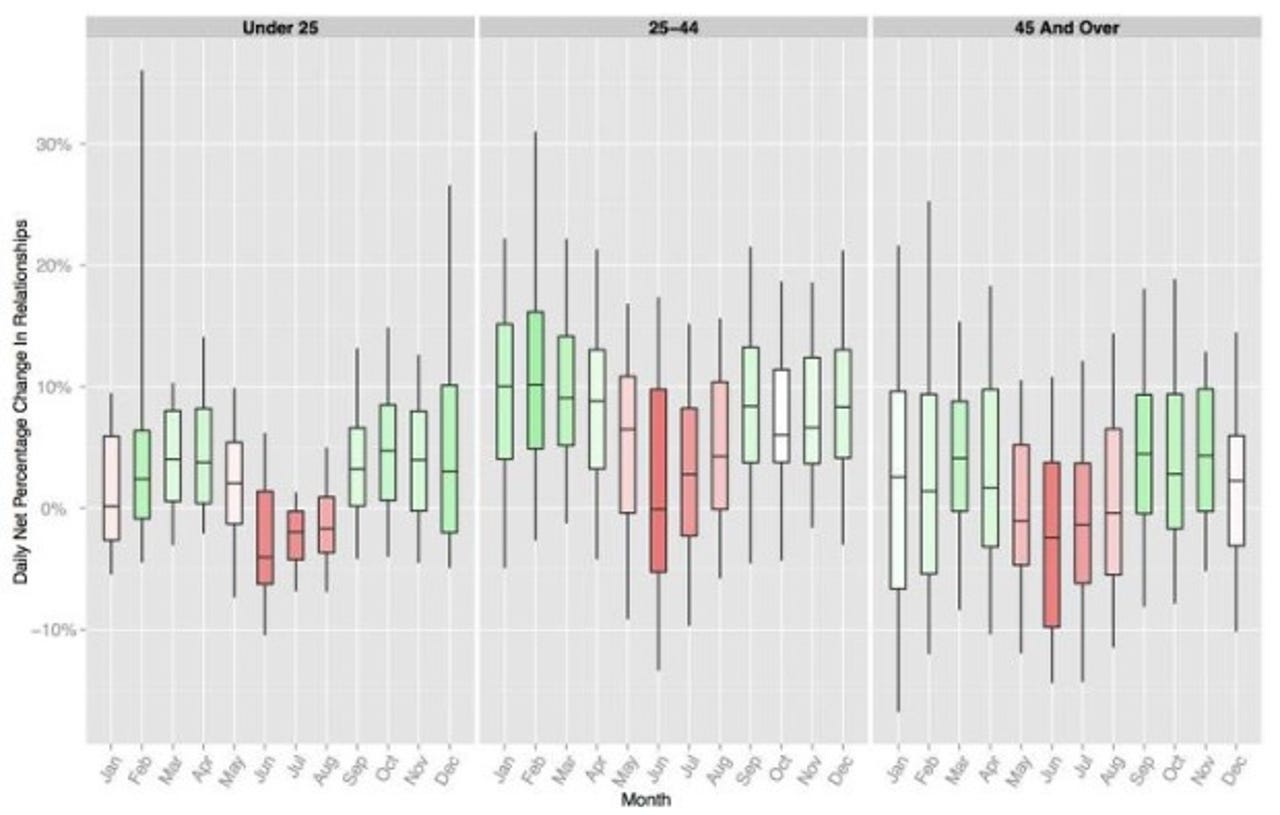
Facebook took the daily data, grouped it into months, and partitioned into three ranges based on age (under 25, between 25 and 44, and 45+), resulting in the above chart. For each of these three age ranges, Facebook calculated the net percentage change in relationships for every day in 2010 and 2011, and then plotted the distribution of daily values by month.
The boxes and whiskers represent the 5th, 25th, 50th, 75th, and 95th percentiles of the net percentage change on the days in each month. The colors of each box represent the month's relative extremity in terms of relationship changes, computed by comparing each month's average with the overall yearly average. A month tinted green is above average in terms of net relationship gain and tinted red if below average. The more the month differs from the yearly average, the deeper the hue.
Across age groups, the summer months are bad news for relationships. In 2010 and 2011, May through August were clearly lower than the other months of the year, suggesting the daily net change in relationships reaches a low during the summer. The large tail in February for the under-25 group can be explained by the net gain in relationships on Valentine's Day.
As for the days of the week, there is a net gain in relationships after the weekend while relatively more break-ups happened leading up to the weekend. The weekend's festivities often result in new social ties. On the flipside, people looking for a change tend to end their old relationships in time to spend the weekend with friends, get back in the game with someone new, or just want to wait until the work week winds down.
See also: