CartoDB: From Alcatraz to elephants, startup puts open source visualisation on the map

Sometimes, creating a successful business isn't just a matter of having a good idea. Sometimes, what you really need is luck.
Javier de la Torre and Sergio Álvarez Leiva certainly had luck when they published the right material at the right time.
In 2007, they started working together on a data visualization project involving conservation and biodiversity. They both like science and were curious to know how protected areas help conserve endangered species, so they took public data from different UN agencies, analyzed it, and published the results in a blog entitled Biodivertido. As luck would have it, the United Nations saw the result, contacted them to say it had long wanted to do something similar - and said it wanted to hire them.
Bootstrapping
De la Torre, an agricultural engineer, and Álvarez Leiva, a computer scientist, decided it was the perfect time to start a business.
"We saw it was possible to work on what we really like to do," Álvarez Leiva told ZDNet. "Data visualization is a niche market, so we thought we could make a living on that," he added. At the time, the tools available on the market weren't sufficiently developed to do what the two entrepreneurs from Madrid wanted them to, so they created their own using open source technology.
They created software to process millions of data points and display the results on a map to help better understand a problem or tell a story. Thus Vizzuality - their company - and CartoDB - its flagship product - were born, thanks to bootstrapping, some public funding, and hard work.
Their early projects dealt primarily with the environment and biodiversity, but not exclusively, recalls Álvarez Leiva. They visualized Amazon deforestation for Google.org and worked with NASA to crowdsource mission planning and biodiversity monitoring projects. They also analyzed the Spanish general elections of 2011 for Spanish public television broadcasters, a project that won the company a Malofiej award, which recognizes the best infographics published in print and online across the globe.
In April 2012, they decided to take the next step. Passion and luck can't blind you to the realisation that you need to pivot or change your product, so they created CartoDB as a spinoff of Vizzuality.
"We put aside bootstrapping and directly looked for a series A round, because we already had the product and customers like the Wall Street Journal, the Guardian and NASA," Álvarez Leiva said. "The advantage we had is that geospatial maps are useful in any sector. Communication and journalism, in particular, represented a perfect opportunity as data visualization is a powerful tool to tell stories and at the same time media can showcase the product. So we talked with data journalism organizations and got very powerful use cases."
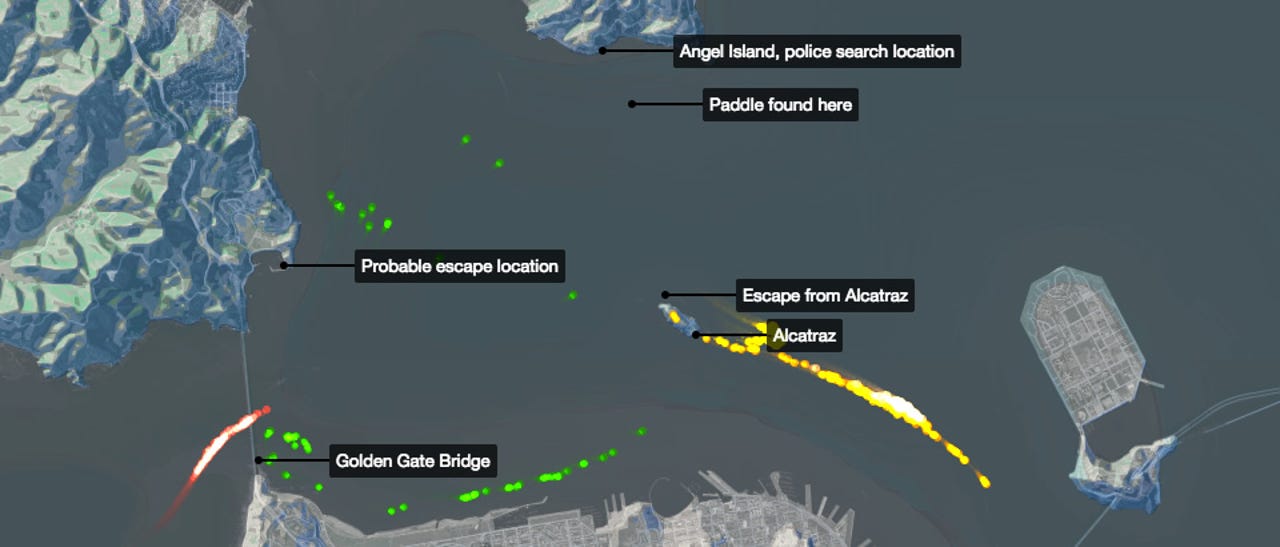
Some of them are displayed on CartoDB's website, from the nocturnal movement of elephants in Kenya to Alcatraz escape scenarios, through to the impact of the UEFA Champions League on Twitter or the recent Mobile World Congress in Barcelona. "We want to tell stories that we feel are important," said Álvarez Leiva,
Between Madrid and NYC
The company cofounder recognizes that "seeking funding makes you realize the issues at hand".
"It's not just the pressure to repay," he added. "It's rather the pressure to prove to yourself that you can grow and do other things." Moreover, with venture capital, "you have the feeling of being on the verge of losing control nearly all the time, but that's the game".
"We are aligned with our investors. They help us to go forward," he said.
In late 2014, CartoDB raised $8m from Germany's Earlybird Venture Capital, and Spain's Kibo Ventures and Vitamin K. The funding boost came with changes in the organization of the company that separated the engineering function, based in Madrid, from sales, based in New York, where the CEO of the company, de la Torre, lives.
Now, CartoDB is a US company. "Basing production in Spain represents a huge competitive advantage as it gives us access to talent. In the US, competing with Google, Facebook, Apple, etc, it's very difficult to create a stable and strong team. In Spain, we have many more opportunities to hire the best engineers in the market," de la Torre said.
And, thanks to technology, distance doesn't make managing teams any more complicated. "Several people in the company work remotely from the West Coast [of the US] and Europe," CartoDB's CEO said.
Half of the company's board members are based in Madrid and the other half in New York, which is no barrier to maintaining a cohesive, competitive and dynamic company, according to de la Torre. "Yes, we travel quite a lot between Madrid and New York," but it's worth it, he said.
"The US is the biggest digital market and introducing technology is much easier there than in Europe or elsewhere. Yet we sell to customers in more than 50 countries and have users in nearly 200," he added.
Both de la Torre, speaking from New York, and Álvarez Leiva, from Madrid, agree that the future of the company, which now has 47 employees, a community of 100,000 users, and a network of 80 partners, lies in the US.
Today, only 11 percent of CartoDB's customers are in Spain, a percentage that's almost symbolic of the country's tendency to "think small," according to Álvarez Leiva. "Spain is a great place to find talent and to live, but for developing software, it's better to leave the country. It is a market issue," he said.
And with Google Maps Engine support set to end next January, CartoDB is positioned as a replacement for the service, a move that should grow its market.
Analytical future
The CartoDB platform allows users to create interactive maps and display georeferenced information, with an emphasis on performing geospatial analysis. Visualizing the information, said Álvarez Leiva, is almost the easiest part. Before that, data has to be gathered, cleaned up, eventually cross-referenced with Twitter comments and Instagram pictures, and then analyzed to put a headline to the story.
For Álvarez Leiva, a computer scientist, the most important thing is that the maps help people to do things they couldn't do before, and allow business intelligence users to make better informed decisions.
"We have more than 100,000 users creating maps and doing geospatial analysis. We are very proud. It is especially good to know that you're developing a product that improves things. That motivates us," de la Torre said.
Read more from Spain