Data science vs social media disinformation: the case of climate change and the Australian bushfires

Has human-induced climate change altered the likelihood and intensity of fire-weather risk in the southeastern Australian bushfires in 2019/2020? This is the question World Weather Attribution (WWA) set out to study, and results suggest there is a link between the Australian bushfires and human-induced climate change.
WWA is an international effort to analyse and communicate the possible influence of climate change on extreme weather events, such as storms, extreme rainfall, heatwaves, cold spells, and droughts. Climate change attribution was recently listed as a breakthrough technology by MIT Technology review, and WWA is behind this.
Today, WWA just released an analysis on the recent Australian bushfires, and ZDNet connected with WWA to learn more about it. At the same time, another analysis by the Brown university verifies what previous studies suggested: climate disinformation on social media abounds. The battle between bots and (data) science is raging.
Reducing the cost of weather-related disasters
Recognising society's interest in reducing the human, economic, and environmental costs of weather-related disasters, WWA delivers timely and scientifically reliable information on how extreme weather may be affected by climate change. This is how the WWA describes its mission.
Scientists were previously reluctant to link any specific event to climate change. But the increasing volume of data spreading over longer periods, and covering more points of interest, has enabled scientists to make more attribution studies with more reliable results.
Increased computing power means scientists can create higher-resolution simulations and conduct many more virtual experiments. Having previously covered the data science behind weather and climate, we connected with Dr. Friederike E. L. Otto, Acting Director of the Environmental Change Institute, who participated in the WWA Australian bushfire attribution study.
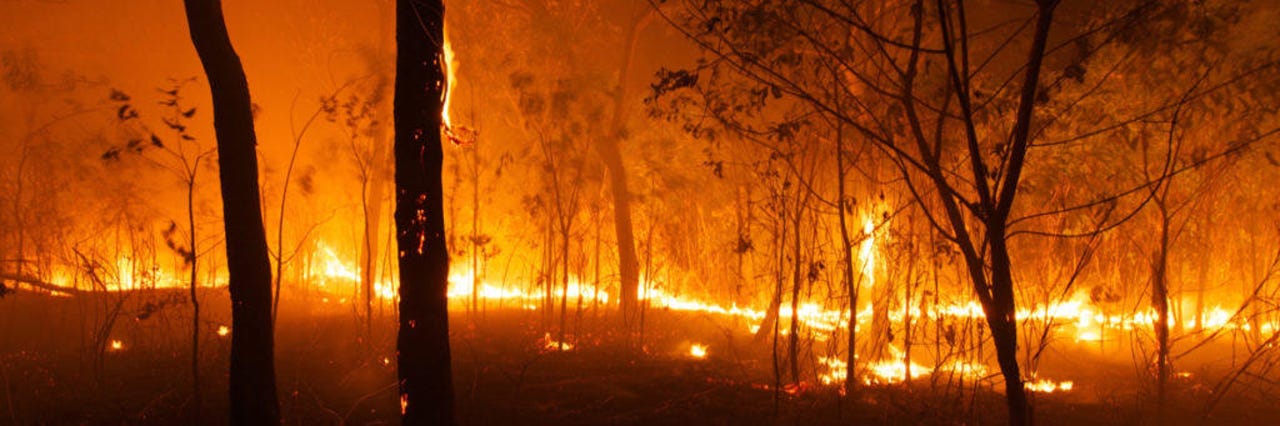
The Australian bushfires wreaked havoc. A new study shows that anthropogenic climate change made things worse. Image: World Weather Attribution
The study aimed to investigate whether human-induced climate change altered the likelihood and intensity of fire-weather risk in the southeastern Australian bushfires in 2019/2020. It also aimed to answer the same question for two key components of fire-weather, extreme high temperatures and lack of rainfall.
The study was conducted using a well-established protocol that was used in many previous extreme event attribution studies. In this, WWA computed the change in probability of a Fire Weather Index (FWI), extreme heat or drought as high as observed in 2019/20 in the current climate compared to the climate of around 1900 in both observations and climate models.
FWI is an estimation of the risk of wildfire. It was introduced in France in 1992 but is based on a Canadian empirical model developed and widely used since 1976. Four climate models for which FWI could be calculated show that the probability of a FWI this high has increased by at least 30% since 1900 as a result of anthropogenic climate change.
The effect of anthropogenic climate change
Projected into the future, the models simulate that a FWI at the 2019/20 level would be at least four times more likely with a 2 ºC temperature rise, compared with 1900. The heat analysis points to similar conclusions: anthropogenic climate change has made a hot week like the one in December 2019 more likely by at least a factor of two.
What's more, WWA notes that model limitations make those results likely to be underestimates. While drought analysis showed non-significant trends, we asked Otto about the nature of the analysis, the tools and methods used, as well as the nature and provenance of the data.
Otto noted they always use observational weather station data and climate models that are freely available. In some cases they also use observational data that can only be accessed through partners at Meteorological services. For the FWI era5 was used too; era5 is reanalysis data, as the FWI contains variables for which real observations are not available.
The list of climate models is in the report, and they are run by WWA partners. For the observational data WWA always works with local meteorologists to identify the dataset with the best coverage and least errors, to get as good a picture of what the weather was and is as possible. Models able to simulate extremes are used, and then evaluated against observations.
Anthropogenic climate change has made a hot week like the one in December 2019 more likely by at least a factor of two. Image: WWA
Only if the models are not obviously wrong are they included in the analysis, said Otto. In this study, she went on to add, this was a real challenge. The models were all not great, but they all underestimated the trend in observations in a similar way so they could still be used to get a conservative estimate. The University of Oxford sent their model to volunteers of the weather@home system and collected results within a few weeks. All the data WWA used is publicly available.
Otto emphasized that WWA keeps it very simple in terms of data analysis so as to understand what is happening. The Climate Explorer, a web application for climate data statistical analysis, is a key part of this. It started in 1999 as a simple web page and has grown over the years to more than 10 TB of climate data and dozens of analysis tools.
The data used is freely available climate model data stored on different servers around the world. WWA subsets the data needed on these servers and then analyses them via the Climate Explorer or standard Python routines, the R language, and common plotting routines. Mainly statistical methods are used to analyse observations and model simulations.
Social media disinformation vs science communication
While not all results were statistically significant, and WWA was transparent about this, the ones that were showed a connection between anthropogenic climate change and extreme phenomena such as the Australian bushfires. Simple data science techniques and infrastructure facilitated the work of WWA to be able to draw conclusions from incomplete data.
The big question, however, is how to effectively communicate those results. Disinformation campaigns were promoting conspiracy theories about Australian bushfires while the fires were still raging, according to research by the QUT. Recent research by Brown University shows that this was not a one-off phenomenon.
According to the study, published by the Guardian, on an average day during the period studied, 25% of all tweets about the climate crisis came from bots. This proportion was higher in certain topics - bots were responsible for 38% of tweets about 'fake science' and 28% of all tweets about the petroleum giant Exxon. Social media campaigns tend to be well-funded.
Not all bots are benevolent. Photo Creative Commons by Rob McDonald from Flickr
A stark contrast with Climate Explorer, which currently runs on a small academic cloud provider in Amsterdam and is effectively a one-man project. Geert Jan van Oldenborgh, R&D Weather and Climate Modeling at the Dutch Meteorological Institute, told ZDNet that data storage is a big problem:
"They charge a lot per TB and storing the data locally costs a lot of money. I currently have 14 TB but would love to get more. We are trying to adapt our code to be able to use remotely-stored data over OPeNDAP. The visualisations are very primitive, based on 1990s technology when I started programming the Climate Explorer".
Contrast this - worrying over 14TB worth of scientific open data - to the seemingly endless resources at the fingertips of Big Tech, typically used to develop and train even more sophisticated Deep Learning models. Perhaps someone could step in and offer to help store that public data to facilitate research for the greater good.
Going back to the Brown study on social media, tweets that could be categorized as online activism to support action on the climate crisis featured very few bots, at about 5% prevalence. Besides often being less comms-savvy, well-funded and well-staffed than the other side, scientists have an additional barrier to overcome: interpretability.
There is lots of nuance to those results, while spreading disinformation comes easy. This is a good reminder that social media platforms need to do more to remove disinformation, and create a level playing field. They may be commercial entities, and as such subject to internal power games, but they carry a lot of responsibility for society at large.