From cars to catamarans, how big data plays in sports

SAN FRANCISCO—Big data is hardly the most exhilarating topic, inside or outside of the information technology industry. But it's playing into the world of sports in a major way, and on both sides of the fence. (All puns intended.)
One simple, obvious, but still quite effective way that big data serves sports fans? The statistics hub.
During a media luncheon on August 22, SAP chief marketing and communications officer Jonathan Becher revealed that one of the business software company's most popular apps is actually directed at consumers: the stats page for NBA.com.
The cloud-based directory is teeming with scores, news headlines, social media tie-ins and charts analyzing players' shots over games that span the last several seasons. Since its February launch, the SAP-powered site has registered more than 13 million users, Becher said.
It's not SAP's only effort in the area, either. The company has signed contracts with the New York Yankees baseball team (which, Becher quipped, is looking to use SAP's apps to write "Moneyball 2.0") and the San Francisco 49ers football team, for which SAP already serves as sponsor for the team's new stadium.
SAP is not the only technology company that has reached out to the National Football League. With the NFL's pre-season already underway, Intel has touted its own big data partnership with the league that aims to improve the fantasy football experience.
According to an Intel study published this month, approximately 75 percent of people who play fantasy football expect that detailed data is delivered in real-time. Furthermore, 66 percent of fantasy football players believe that technology such as websites and applications help them best manage their fantasy teams.
"Fantasy football is one of those situations where the fans want to be connected to the players," NFL Hall of Fame player Jerry Rice remarked during a panel discussion about the collision of big data and fantasy football held here on Wednesday by Intel.
Is Hadoop the key to unlocking big data?
Josh Zerkle, a senior writer covering the NFL for the sports website Bleacher Report and who spoke at the event, went further. "Data has ravaged the way we watch sports," he said, "trumping the stadium experience."
The trend is driven by mobile devices, said Boyd Davis, vice president and general manager of Intel's datacenter software division. Mobile content—such as interactive polls or video "webisodes" that are playable with a single tap or flick of the finger—is driving richer user experiences, he said. That leads more demand for more powerful devices, which in turn creates more data.
It's a cycle, Davis said. But "the complexity of making it simple is much more complicated."
One way Intel aims to support the trend is by offering its Graph Builder for Apache Hadoop, an open-source software tool that takes separate pieces of data—such as travel schedules, game times, weather, team composition and injury frequency—and weaves them together, using visualizations, to demonstrate patterns that could contribute to an eventual win or loss.
Big data is also filling in gaps for coaches and their staff.
There are approximately 92 data points per play in a game of American football, according to John Pollard, general manager of the sports solutions group at the sports tech and data firm STATS. That's helpful even if the game of football—different from other sports in that some scenarios are difficult to quantify and track over time, such as the movement of a team's offensive line—is otherwise challenging for data collectors.
And then there are "wearables," short for wearable technology. Rice, who won three Super Bowl championships playing for the 49ers and a conference championship with cross-bay rivals the Oakland Raiders, championed the cause, highlighting how the technology is used to track players' heart rates, calories and more, enabling athletic trainers to tailor training regimens that could more carefully avoid accidental injury.
More about big data in IndyCar racing and the America's Cup >>>
Team sports aren't the only area for big data to make a big impact.
For years, sensors have been used on the auto racing circuit by drivers looking for an edge.
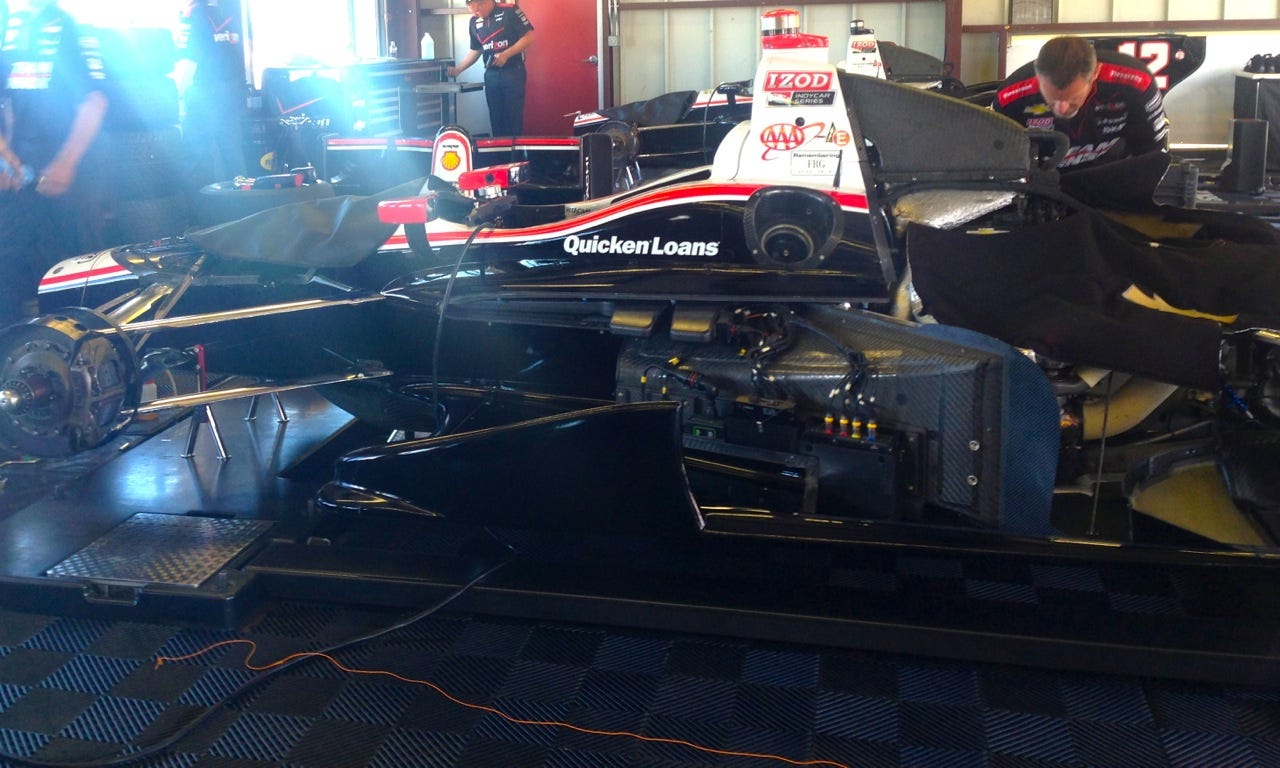
Speaking ahead of the start of the IndyCar GoPro Grand Prix series race at the Sonoma Raceway on August 25, Penske Racing strategist John Erickson told this ZDNet reporter that there are some 200 data points scattered around a one-person vehicle. With them, strategists on the sidelines can get immediate readings for the car's tire pressure and temperature, oil temperature, brakes and more.
Ron Ruzewski, technical director for Penske Racing, acknowledged that the sensor data still requires a person to make a decision. At Penske Racing, there are typically three people analyzing the data during a race. Real-time availability matters: Penske team representatives say they can make decisions about the race in as little as 30 seconds and then implement them within a window of five to six laps, depending on the car's fuel level.
And how much data, you ask? Erickson said that the sensors collect roughly five gigabytes per lap. With 85 laps per race in the IndyCar Series, that is a lot of data—not only to be monitored during the race, but also to be saved somewhere for post-race analysis.
Penske reps said the organization partners with Hitachi to offload the data in the cloud and on a physical server. Some of the data arrives already structured, thanks to post-processing done on the car itself.
***
As streams of data rapidly flood the world of professional sports, regulatory bodies aren't always quick to welcome the added effect.
In NASCAR auto racing, for example, data can be recorded during the race for later use but it cannot be used while the race is underway, Erickson said.
The approach is similar for the sailing world's oldest event, America's Cup. The 45- and 72-foot long catamarans that race around the San Francisco Bay (now through September 21) have some 2,000 data sensors on board.
On August 24, Oracle chief marketing officer Judy Sim gave ZDNet a preview of how the sensors work during a practice session ahead of the Louis Vuitton Cup, the challenger series of the America's Cup. (Oracle sponsors the event.)
Tracking wind and pressure on the sails, among other metrics, the sensors allow the boat's crew to make alterations, such as trimming the flaps on the wings to change speed and direction, as necessary.
In the case of the United States team sponsored by Oracle—the defending champion—it's fairly obvious who is providing the technical back-end infrastructure for the catamaran's sensor system.
The U.S. team is fortunate in that it has two boats available to race, twice as many as challengers Italy and New Zealand have at their disposal. The U.S. team uses some of the collected data to determine which catamaran to use in a race on a particular day, up to an hour before the race starts.
But the power of big data goes away with the firing of the starting gun. According to event rules, all electronic sensor data is barred from use during the race. The equipment is packed into floating black boxes and must be dumped off the side of the boat before taking off. (The boxes are then later picked up by race officials.)
Not that it would be helpful. Sim says that, given the constantly changing weather conditions on the San Francisco Bay, the data can be misleading. As the great American baseball player Yogi Berra once said, "If you don't know where you're going, you'll end up somewhere else."
Images: Rachel King, ZDNet