Geotab launches dashboard to track post COVID-19 economic recovery

Geotab has launched a commercial transportation dashboard to gauge the progress of the post COVID-19 economy.
The company, which specializes in connected transportation and Internet of things applications, is processing data from more than 2 million Geotab connected vehicles to visualize trade activity.
Geotab said that its aggregated and anonymized data points will track things like commercial vehicle activity, trade and fuel fill-ups as economies reopen after the COVID-19 pandemic. The dashboard will be updated regularly and provide week-to-week analysis to gauge activity in industries such as waste management, healthcare and manufacturing.
As COVID-19 data sets become more accessible, novel coronavirus pandemic may be most visualized ever
Components of the Geotab Commercial Vehicle Recovery Dashboard, include:
- An Activity Index, which tracks North America and tracks commercial vehicle trips compared to normal operations and other areas.
- A Trade Index to track cross-border activity between the US and Canada and Mexico.
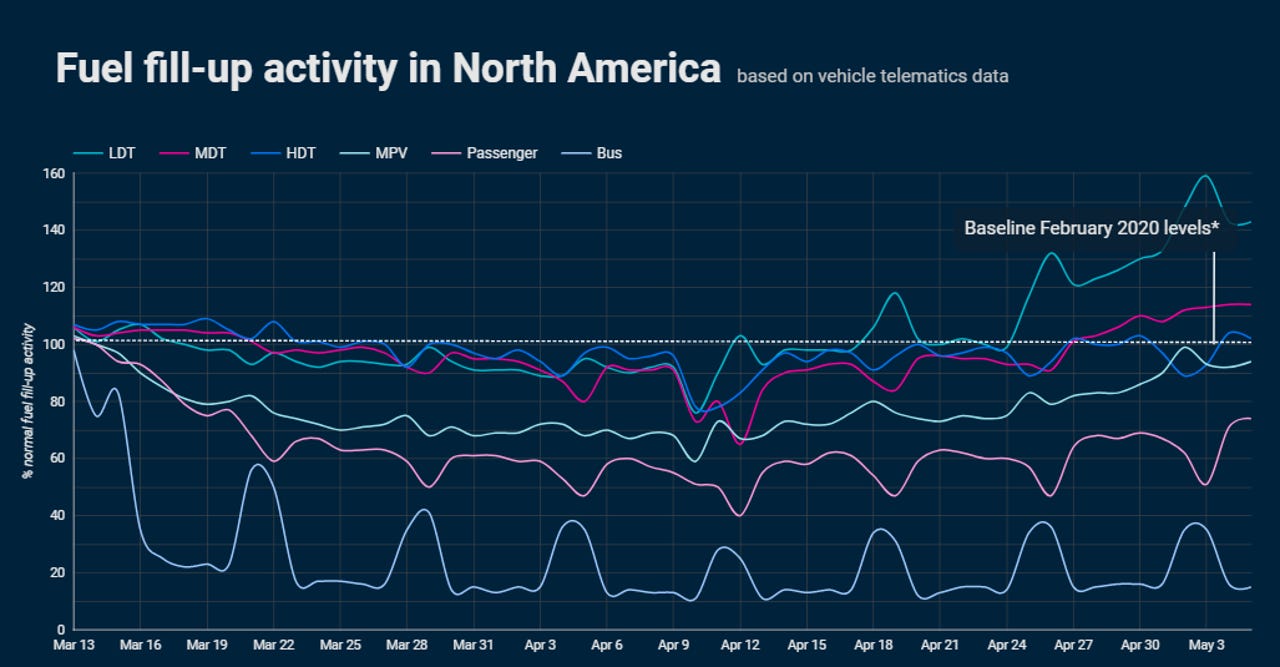
- A Fuel Index that tracks fuel fill-ups relative to normal operating behavior.
- An Industry Index to track volume of trips.
Here's a sample.