Panama Papers: Finding connections using the power of the graph database

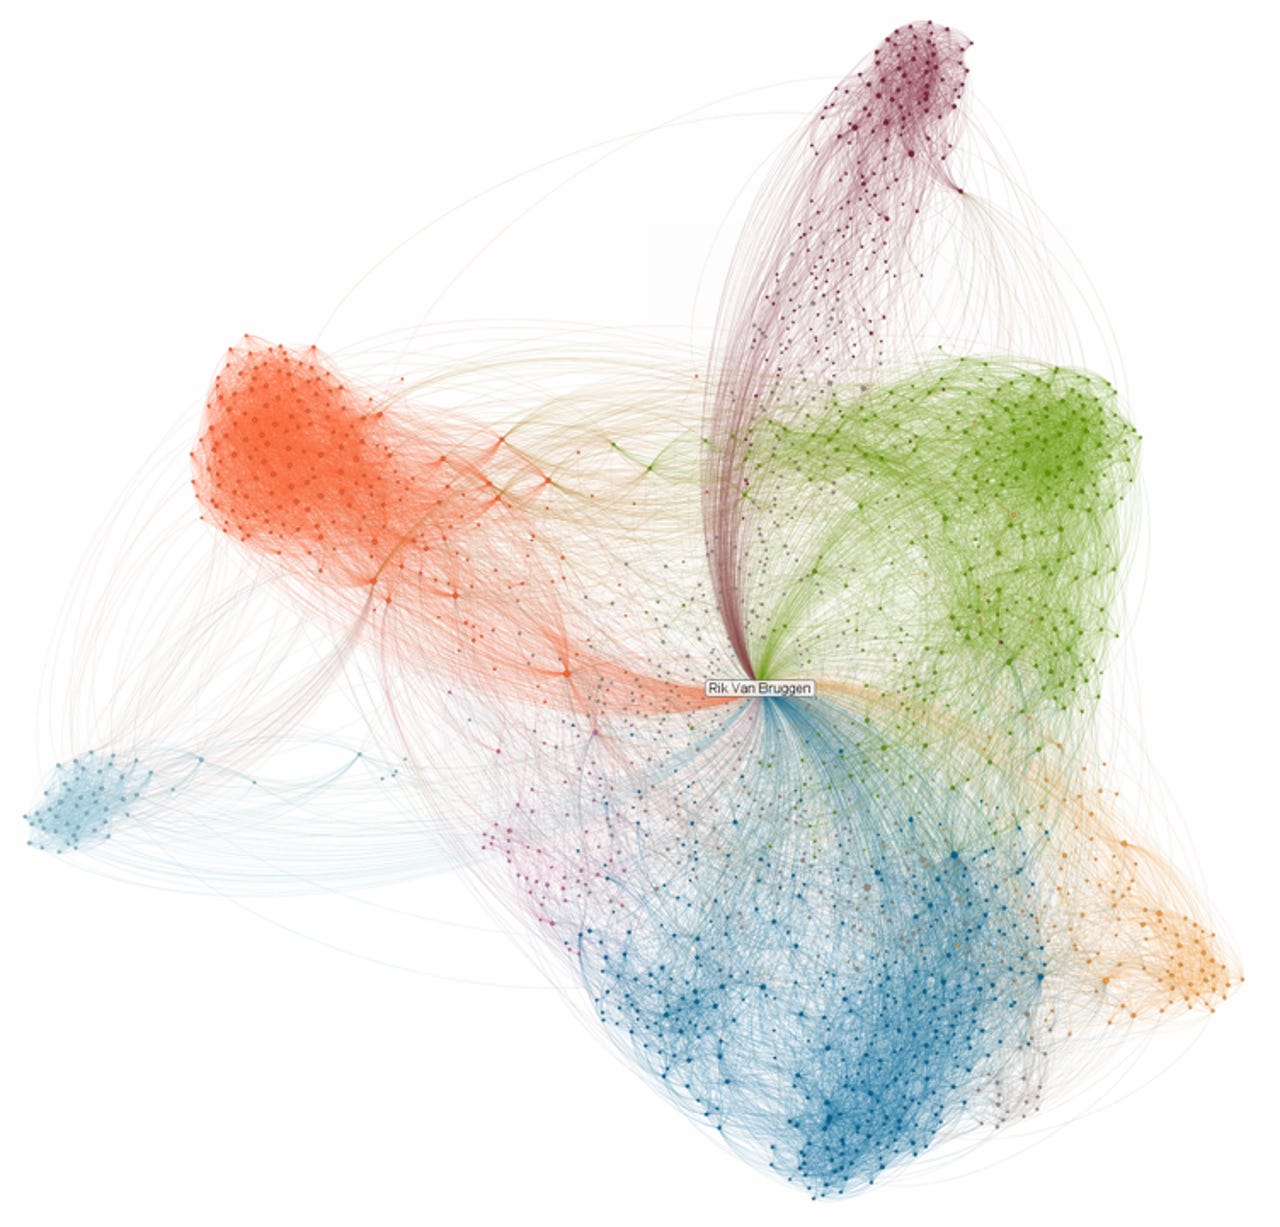
Graph databases like this one from Neo4j can illustrate patterns in large data sets, like those involved with the Panama Papers.
Before April this year, if you had thought about Panama at all it would probably have been while leafing through a holiday brochure.
But the tiny Central American republic is now also associated with the huge leak of financial records known as the Panama Papers, which have revealed how huge amounts of money have apparently been been hidden in tax havens around the world.
The revelations are the work of the International Consortium of Investigative Journalists (ICIJ), a New York-based organisation with members including the Washington Post and Le Monde as well as the UK's Guardian and BBC.
To sift through all the data, journalists used graph database software from Neo4j. To find out how this technology unravelled the biggest news story of the decade so far, we spoke to ICIJ's data editor, Mar Cabra.
ZDNet: Is your background in journalism?
Cabra: Yes, I am a trained journalist. I was a TV journalist at first and did various work including as a TV journalist here in Manchester. I worked for CNN plus in Spain and for network news there.
But then I realised that I didn't quite fit into the fast-paced news line and so I went to university in New York and specialised in investigative journalism. It was there that I discovered data journalism and how data can be used to create systematic stories. And then from data journalism, I started to work with developers and that is how I got into the ICIJ and started to do investigative reports. I have been head of investigative reports there since 2014.
Q: How do you set about developing stories based on data?
With the Panama Papers, our colleagues at Süddeutsche Zeitung got this large leak of 2.6 terabytes of data and they came to us and said, 'Hey, we can't possibly analyse all this, let's get a team together'.
My team spent a good couple of months looking into the data to look first at how we could tackle this dataset. By that I mean a combination of data and documents. So we started by saying, 'let's process these documents and then see what sort of analysis we can perform and then see what the story is'.
ICIJ's Cabra: "One of our core questions is, 'can we speak about this systematically?'"
Sometimes we have a problem that has data in it and we try to figure out how to solve it. Other times it is different, for example we did something on the World Bank. One of our investigative reporters picked up something from sources that suggested that the World Bank was financing development projects all around the world that were displacing people, either economically or physically, and this was a widespread problem.
We looked into it and it did seem to be a problem, so our next step was to ask: How can we quantify this problem so that we can talk about it from a systematic perspective? What are the data sources? How can we tackle this? How can we deal with this as a systematic problem?
At ICIJ we always try to establish three criteria when dealing with a topic. And we only deal with two or three problems a year so the questions are very important.
The three questions are: Is it of a global concern? Are we dealing with a system that is broken? And, are we likely to get a result?
As you can see, one of our core questions is, 'can we speak about this systematically?' Whether we already have a dataset or whether we know that there is a problem, we need to show that it is systemic.
Q: So this is ground-breaking stuff, life-changing issues?
You know, right now there is no investigation that we are doing, that is underway that doesn't have a data component. If you think about data from a journalistic perspective -- and, I guess, from a business perspective too -- it shows you how something happens in a systematic way. And then from a journalist's view again, it can show you stories that you may not have known about.
Q: How did the ICIJ get involved in graph data?
Back in 2014 the ICIJ published a list of some 1,400 offshore tax havens and a list of more than 100,000 companies that were using these tax havens. We just published a lot of data and for the last three years, that has been the most successful product that ICIJ has produced.
Our public, our readers were amazed and just loved it -- and then they went off and did their own work and kept on expanding the networks.
The first thing we realised was that it was very popular for the data but then we thought that maybe it would be interesting from a reporting perspective.
We started looking at software that allowed us to visualise graphs internally. We asked around for suitable software and Neo4j was recommended. We tried it out, we liked it, and off we went.
It was very good because it was very easy to use. They just give you a license, you put it on your server, connect to the Neo4j database, and within hours you're visualising. You just put the password protection on top of it and there you have it. It is very easy to have in a closed network.
Q: Did you use it on something else before the Panama Papers came along?
We used it on the Swiss leaks data -- the HSBC data. But in that case we were only able to use it towards the end of the project. It was very helpful for fact checking and to make sure we had explored all of the connections. And it established very quickly that we had missed some connections.
It was very useful to see documents and to see graphs, and our brains are not wired to see graphs. You can look at documents and you can draw things because you can see them. But I remember when our reporters were using [Neo4j] back then, they were saying, 'oh my god, this is like magic, I am finding connections that I had missed'.
When we started on the Panama Papers a year ago, one of the first questions from my boss was, 'so we are going to have a graph database right?'
Q: You had the Panama Papers and Neo4j -- what's next?
We needed a platform to explore documents, to search documents -- basically a private Google that allows us to search documents and gives us a way to explore the connections but only of the client database.
I think we could have done much more. For example, even documents can be structured so take for example emails. I was just talking to a colleague who stopped me when I was coming here. He said, 'you need to do something with emails'. I said we couldn't because we didn't have enough time. But all emails have data: the sender, the 'to' and 'from', the subject and so on.
We could have abstracted the metadata and analysed the patterns of behaviour at Mossack Fonseca and all that, but we just didn't have time. But that's also a graph -- you want to see, who is the concentrator of communications, who is communicating with others.
Journalism is all about finding the connections and many times the connections are not straightforward. That is how the graph software allows you to see what is behind these links.
I am fascinated by the idea that we can try to connect everything that we have to understand the world better, to understand the documents that we have.
In the offshore world it is all about these layers of secrecy and graphs are a way to explore them.