Tableau's COVID-19 Data Hub revamped for recovery phase

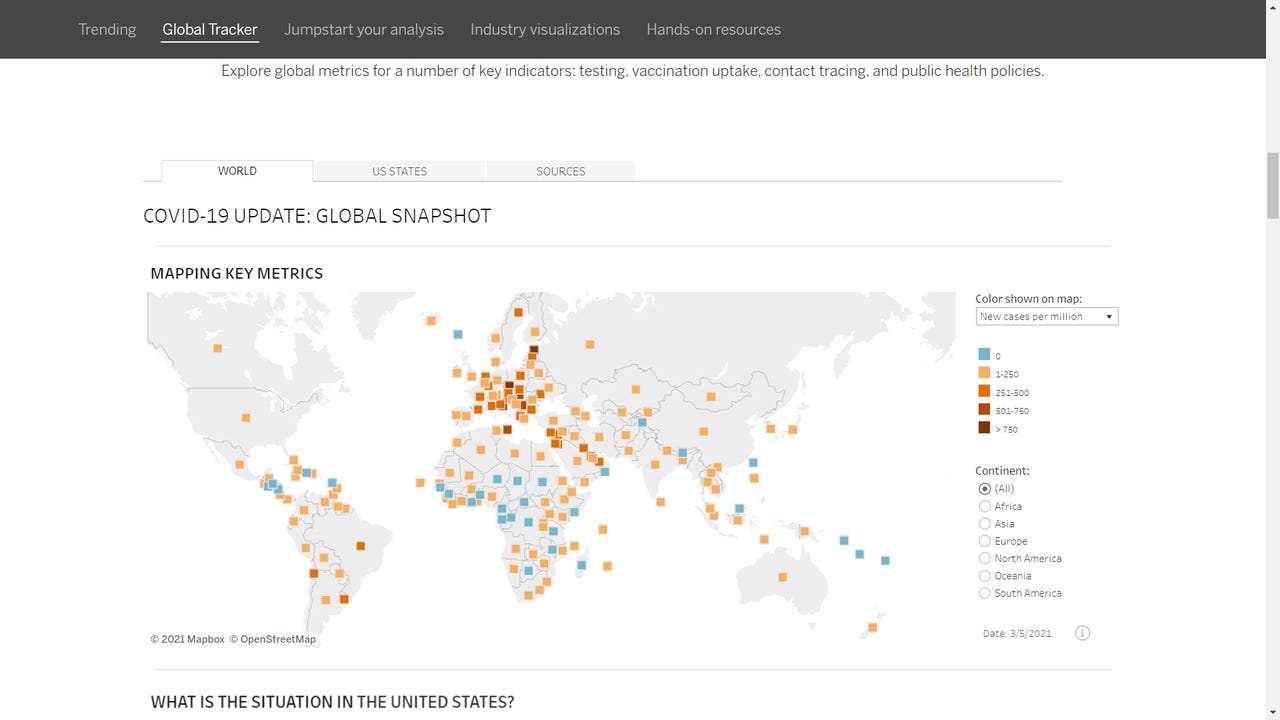
Tableau's COVID-19 Data Hub's Global Tracker, world view
Now that the COVID-19 pandemic is gradually transitioning to a recovery phase, the data analysis challenge is changing. With that in mind, Tableau updated its COVID-19 Data Hub earlier this month, and contacted me about the changes. I wrote about the Data Hub about a year ago, when it was new. Armed with Tableau's briefing on the recent changes, I thought I'd follow up last year's report with an update.
Also read: Tableau makes Johns Hopkins coronavirus data available for the rest of us
I spoke with Jeremy Blaney, Tableau's product manager for Tableau Blueprint, who leads data strategy for the COVID-19 Data Hub, and he gave me some context for these updates. Blaney explained that the Data Hub's update is timely given that The Atlantic's COVID Tracking Project, which had been collecting and publishing data and analysis on COVID testing and patient outcomes, wound down its operation with a final update on March 7th, exactly one year after it launched. People involved in that volunteer project included Atlantic journalists Robinson Meyer and Alexis Madrigal, as well as Jeff Hammerbacher, Founder and Managing Partner at Related Sciences. Hammerbacher was an early pioneer in the intersection of big data and medicine, as evidenced in my interview with him in 2012, back when he was at Cloudera.
Also read: Cloudera and Mount Sinai: The structure of a Big Data Revolution?
Moving on
Now that the world has moved on to a vaccination effort, data folks have to move beyond tracking just the grim statistics of COVID cases, positivity rates, hospitalization rates and deaths. Tableau's COVID-19 Data Hub is meeting the challenge. Yes, visualized metrics in its world and US maps include new cases and new deaths per million people, but new tests per thousand people and total vaccinations per 100 people are included as well.
These maps use data feeds from the New York Times for state- and county-level data in the US and Johns Hopkins Center for Systems Science and Engineering for country-level data, as primary sources. But below the map, a 3x3 grid of time series line charts depict several more metrics, including:
- Vaccine rollout
- Vaccines administered
- Testing rates and eligibility
- Contact tracing
- Lockdown "stringency" index
These charts use identical time periods (from March 11, 2020 to present) and scale, allowing users to see the correspondence between metrics. For example, when lockdown stringency is reduced, positivity rates and new cases may increase a few weeks later. It can also be interesting to see, on their own, the different trends in testing rates across various countries, or US states.
Visual design
In the visualizations, color scales ranging from blue to orange to brown were intentionally chosen over the typical "traffic light" (green/yellow/red) scale, for readability. Another intentional design choice, for the map visualizations, was to use equally-sized square dots per country rather than filled, chloropleth maps. This was done so that that countries with noteworthy metric values, but that are geographically smaller, are nonetheless visible and apparent.
One such country is Israel, which as of this writing has administered 102.3 vaccine doses per 100 people, nationwide. Note that since most of the vaccines requires two does, this does not mean 100% of the population is fully vaccinated. But the rate is a standout -- as of this writing, the corresponding rates in the United States and United Kingdom, respectively, are 27.5 and 34.7.
So many sources, so little time
Tableau's data sources for the Hub include the aforementioned New York Times and John Hopkins feeds, as well as the United States Census Bureau, the U.S. Department of Health & Human Services' healthdata.gov site, the United Nations Department of Economic and Social Affairs, Oxford University and Our World in Data.
With so many sources, as useful as the visualizations are, Tabelau's biggest public service here is arguably the work that went into getting the feeds integrated. Blaney told me that connectors from sister Salesforce subsidiary Mulesoft were used for data acquisition, that Tableau Prep Builder was used to design the various data transformations, and that Prep Conductor is used to run them daily, on new data.
More to explore
For those who want to build their own dashboards, a blended data set of the Hopkins and New York Times data is still available from Tableau, in a public data.world catalog, both in CSV and Tableau .hyper formats. But given the amount of integration work Tableau has done, and the detail in their dashboard, you may just want to stick with that. There's also a starter Tableau workbook available for download, and links to government, healthcare and economic/industrial COVID data visualizations.
As the world slowly makes its way to normalcy, there's plenty of data to explore and plenty of time to explore it.