Give data personality traits to improve analysis

Data should be given "personalities", with different characteristics, so businesses can better analyse the information and extract actionable insights.
Many organisations today were struggling to understand the data available because there was so much information to go through and analyse, said Julie Rodriguez, creative director at Sapient Global Markets.
Latest news on Asia
Speaking at the Strata+Hadoop World conference in Singapore this week, Rodriguez pointed to the concept of "data personality" as a way to help businesses better visualise, and understand, data.
There were infinite traits in personalities and some sought to understand the nuances through certain datasets such as horoscopes, in order to "predict" what might happen during the day or year based on the horoscope they belonged to.
While it was debatable if horoscopes held any scientific truth, the same concept could be applied to data, she suggested. For instance, was it possible to create personality from structured data or understand the behavioural traits of a dataset?
Most businesses today would churn raw data, build these into charts and graphs, and then attempt to join the dots in order establish a cohesive picture. This often proved complex and difficult to monitor at scale.
Using design and visualisation techniques, organisations would be able to more easily understand and analyse data, Rodriguez said.
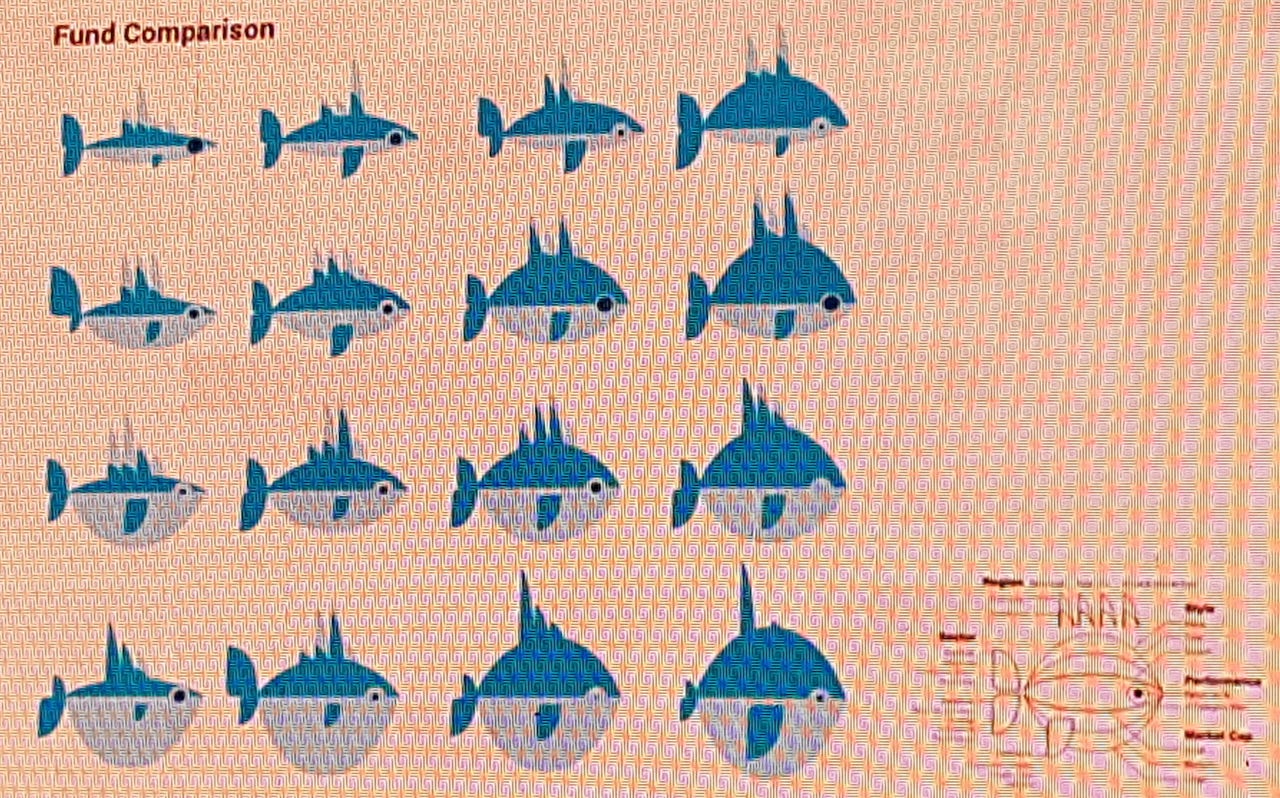
The figure of a fish, for instance, could be used to represent 15 characteristics of a financial fund, she said. Its dorsal fins could represent geographical coverage, while its bottom belly reflected the size of its market cap.
By looking at the shapes of 16 fishes, representing 16 different funds, businesses would be able to more quickly analyse the characteristics of the funds they were monitoring.
This ability to digest different data could prove critical.
According to fellow speaker, FusionEx's director for business solutions Ng Wei Keong, a big part of predictive accuracy was dependent on how easily businesses could bring in data and how they were able to manage the diverse datasets.
One Singapore bank had been tapping data analytics to improve its operations and customer service. DBS Bank's CIO and head of group technology and operations, David Gledhill, said it redesigned its ATM user interface based on analysing human-centred design elements. This initiative slashed queue time by 800,000 hours and halved sequential transactions, from 25 percent to 12 percent.
The bank also carried out behavioural analysis by studying activities at six ATMs, which were placed in a row at a shopping mall. Through analysing the data, it found that the volume of withdrawals and deposits at specific ATMs could be influenced simply by making small changes to its signages and instructions displayed above the machines.
Such revelations highlighted the importance of optimising the design of everything the bank built, Gledhill said, noting the need for continued experiments to improve service delivery.