Tableau adds new data model for multiple sources, KPI monitoring

Tableau has rolled its latest version, 2020.2, that includes a new data model for multiple source analysis without coding or scripting as well as a feature called Metrics, which monitors key performance indicators via mobile devices.
Customers will get those features as well as connectors for geospatial data via upgrade.
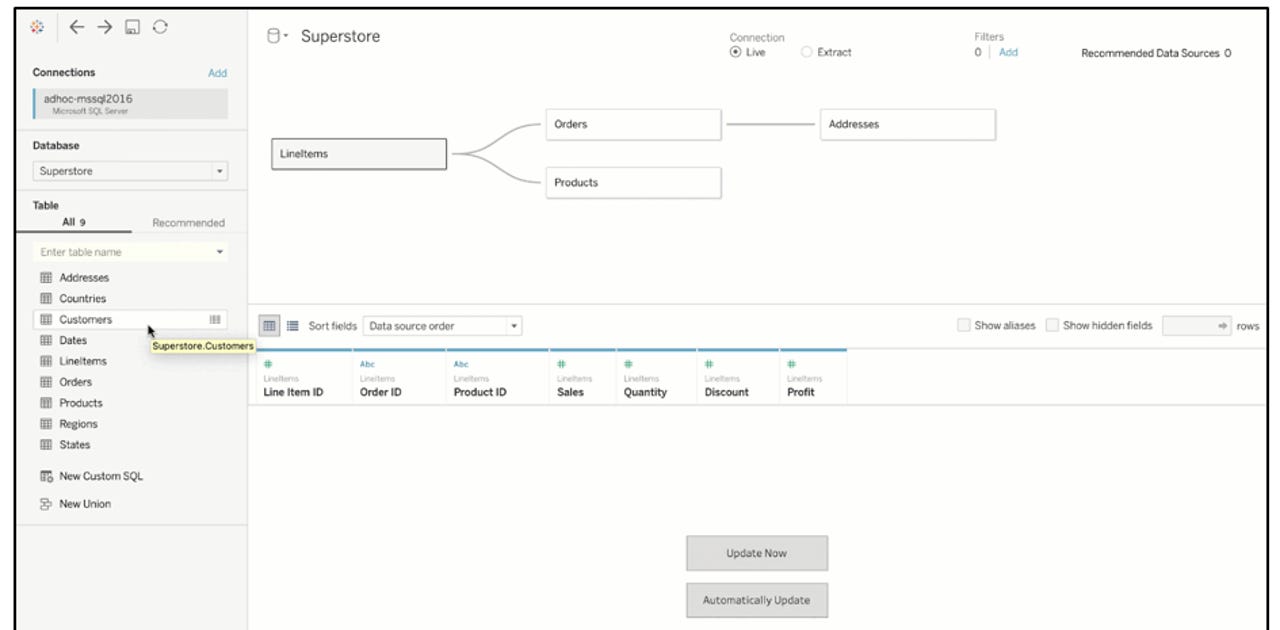
The data modeling is designed to democratize the ability to analyze complex data sets. Tableau has added a drag-and-drop interface to highlight relationships between tables with smart joins of data sources and queries for combined data. Typically, this analysis would require database knowledge and code.
- As COVID-19 data sets become more accessible, novel coronavirus pandemic may be most visualized ever
- Tableau makes Johns Hopkins coronavirus data available for the rest of us
- Data science interest spikes with COVID-19: Here are the online courses to get you started
With the new data model, Tableau will aggregate details for the analysis required. Tableau customer Vantage Information Services said it used the new data model for its COVID-19 analysis and drilldowns into relationships.
Here's a look:
Metrics is another tool in the new release of Tableau that aims to provide a quick view of critical data in one location. Metrics is available via Tableau Mobile through push notifications or in a browser.
According to Tableau, Metrics provides a curated and consistent view of KPIs without the need to use multiple dashboards and filters. Tableau said Metrics wanted to make KPI monitoring as easy as checking a bank account balance.
Here's a screenshot of Metrics.
Tableau also added the ability to visualize Esri geospatial data directly in the application, improved Ask Data to add custom suggestions and bolstered Tableau Prep Builder with native connections to Salesforce data and other advanced data management tools.