Windows Calculator will get a 'graphing mode'

After open-sourcing the Windows 10 Calculator on GitHub at the start of the month, Microsoft has now started work on expanding the app with new features, as it initially promised.
Windows 10
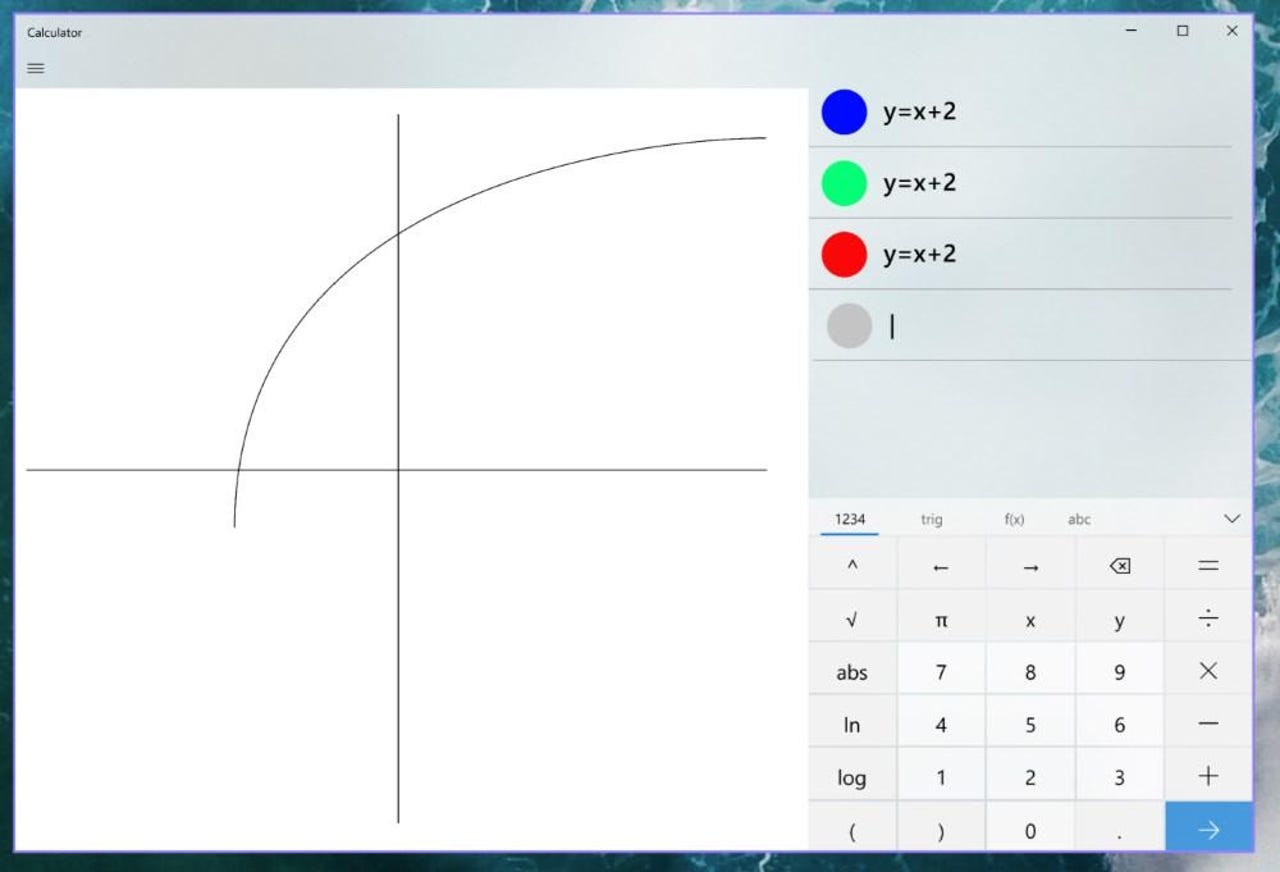
Out of the 30+ suggestions that open-source contributors have proposed so far, Microsoft engineers have selected a proposal called "Graphing Mode" as the first feature to be added to Windows Calculator via GitHub.
As its name implies, Graphing Mode will allow users to create graphs based on mathematical equations, in a similar way to Matlab's (way more advanced) Plotting Mode.
The feature was proposed by Microsoft engineer Dave Grochocki, also a member of the Windows Calculator team.
In a GitHub issue Grochocki submitted to support his proposal, he argued that a graphing mode would help students learn algebra easier.
"High school algebra is the gateway to mathematics and all other disciplines of STEM," Grochocki said. "However, algebra is the single most failed course in high school, as well as the most failed course in community college."
By adding a Graphing Mode to Windows Calculator, an app included with all Windows 10 versions, the Microsoft engineer hopes to provide students and teachers with a free tool to help schools across the world.
"Physical graphing calculators can be expensive, software solutions require licenses and configuration by school IT departments, and online solutions are not always an option," he added.
"Graphing capabilities in their daily tools are essential for students who are beginning to explore linear algebra as early as 8th grade. [...] At present, Windows Calculator does not currently have the needed functionality to meet the demands of students."
Besides its potential for having an impact on the educational sector, Microsoft also took into account user requests received via the company's Feedback Hub app, where a "graphing calculator" was one of the most requested features.
There is no timeline for shipping the Windows Calculator graphing mode feature, as the GitHub issue is currently marked only as in "pre-production."
Goals
- Provide a great baseline graphing calculator experience in Windows Calculator
- Support all US common core math curriculum, including:
- Ability to build and interpret functions
- Understand linear, quadratic, and exponential models
- Trigonometric functions
- Reason with equations and inequalities
Non-Goals
- Support advanced calculus or statistics functionality
- Parity with more advanced graphing solutions
User Cans
- Users can enter an equation so that it can be viewed on the graph.
- Users can enter multiple equations so that they can compare plots against each other and see the interactions between the lines.
- Users can edit equations so that they can see how changes affect the plot and correct mistakes.
- Users can change the graph viewing window so that they can see different parts of the plot at different levels of detail.
- Users can change line visual options so that they can clearly differentiate between multiple plots.
- Users can export graphs so that they can share it with others or incorporate into Office/Teams.
- Users can easily manipulate secondary variables in equations so that they can quickly understand how changes to equations affect the graph.
- Users can see traceable key graph features (KGF) as nodes/dots on the equations, and summon other KGFs in a list so that they can better understand the important features of a given function.
- Users can trace plots so that they can better understand the relationship between variables in the equation on the graph.
Windows 10 May 2019 Update: The new features that matter most
More Microsoft and Windows news coverage:
- Microsoft delivers public preview of Windows Virtual Desktop
- Some Windows 7, 8.1 users reporting Security Essentials and Windows Defender problems
- Microsoft to fix 'novel bug class' discovered by Google engineer
- Microsoft brings Windows 10 security to Apple Macs with Defender ATP
- Microsoft releases Application Guard extension for Chrome and Firefox
- Microsoft tech support scammer pleads guilty to defrauding victims of $3 million
- Windows 10 DHCP vulnerability allows for remote code execution TechRepublic
- 7 ways to take screenshots in Windows 10 CNET