Images: Hurricane Ophelia swamps Carolinas

Ophelia
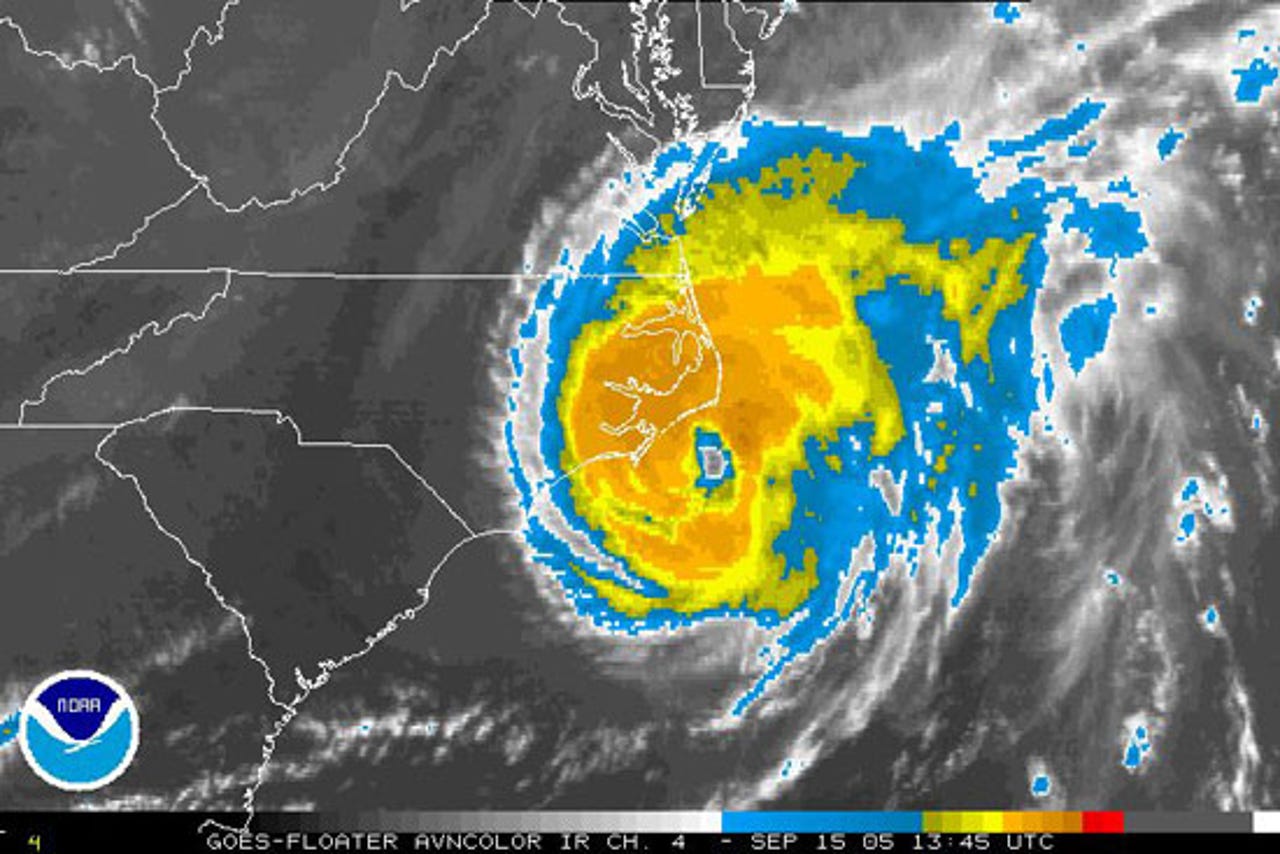
The eye of Hurricane Ophelia is moving slowly at 3 mph just off the coast of North Carolina as of 11:00 a.m. EST, Sept. 15. This Category One hurricane (lowest on the Saffir-Simpson scale) has sustained winds of 80 mph with higher gusts. Ophelia is expected to dump 3-5 more inches of rain on eastern North Carolina in the next 24 hours.
tracking Ophelia
Here is the five-day track for Ophelia as of 11 a.m. EST Sept. 15. This slow-moving storm has taken unpredicted turns.
water temperature
Typically, peak hurricane season lasts from the end of August to mid-September, when water temperatures rise above 82 degrees (as indicated by the orange highlight). This NASA map of water temperatures tracked during Hurricane Katrina shows why that storm picked up intensity over the Gulf of Mexico and why Ophelia gained strength in the Atlantic Ocean.
space station
Hurricane Ophelia as seen from a window in the International Space Station.
TRMM
The Tropical Rainfall Measuring Mission (TRMM) shows the rainfall from Ophelia on Sept. 11, when it was rated as a tropical storm. The blue columns indicate areas that were hit by more than a quarter-inch of rain per hour, green indicates more than a half-inch per hour, yellow more than an inch per hour and red more than two inches per hour.
The rain gets more intense as the storm approaches land. As in the image on the preceding page, the blue columns indicate areas that were hit by more than a quarter-inch of rain per hour, green indicates more than a half-inch per hour, yellow more than an inch per hour and red more than two inches per hour.
Two storms
Ophelia (left) has been brewing off the coast of Florida since Sept. 7, 3:30 p.m. EST. Florida has already been hit by six hurricanes in the past 13 months. To the right is Hurricane Nate, which is winding down.